New on OptionCharts: Gamma Flip, Gamma Profile, Call & Put Walls, and More

Patrick Grenning
Founder
The Gamma Exposure chart just got its biggest update since we launched it. You can now view Call Wall, Put Wall, Gamma Flip, and Gamma Profile directly on the chart, along with a redesigned layout that puts everything in one view.
Here's what changed and why.
Why We Built This
Options traders use gamma exposure to understand where dealer hedging creates support, resistance, and volatility inflection points. But raw GEX bars alone only tell part of the story. We wanted to fix that.
This update was shaped by two years of feedback. The message was consistent: you wanted call wall, put wall, and gamma flip on the chart. Some of you even listed this as a cancel reason. That's about as clear a signal as we could get.
What's New
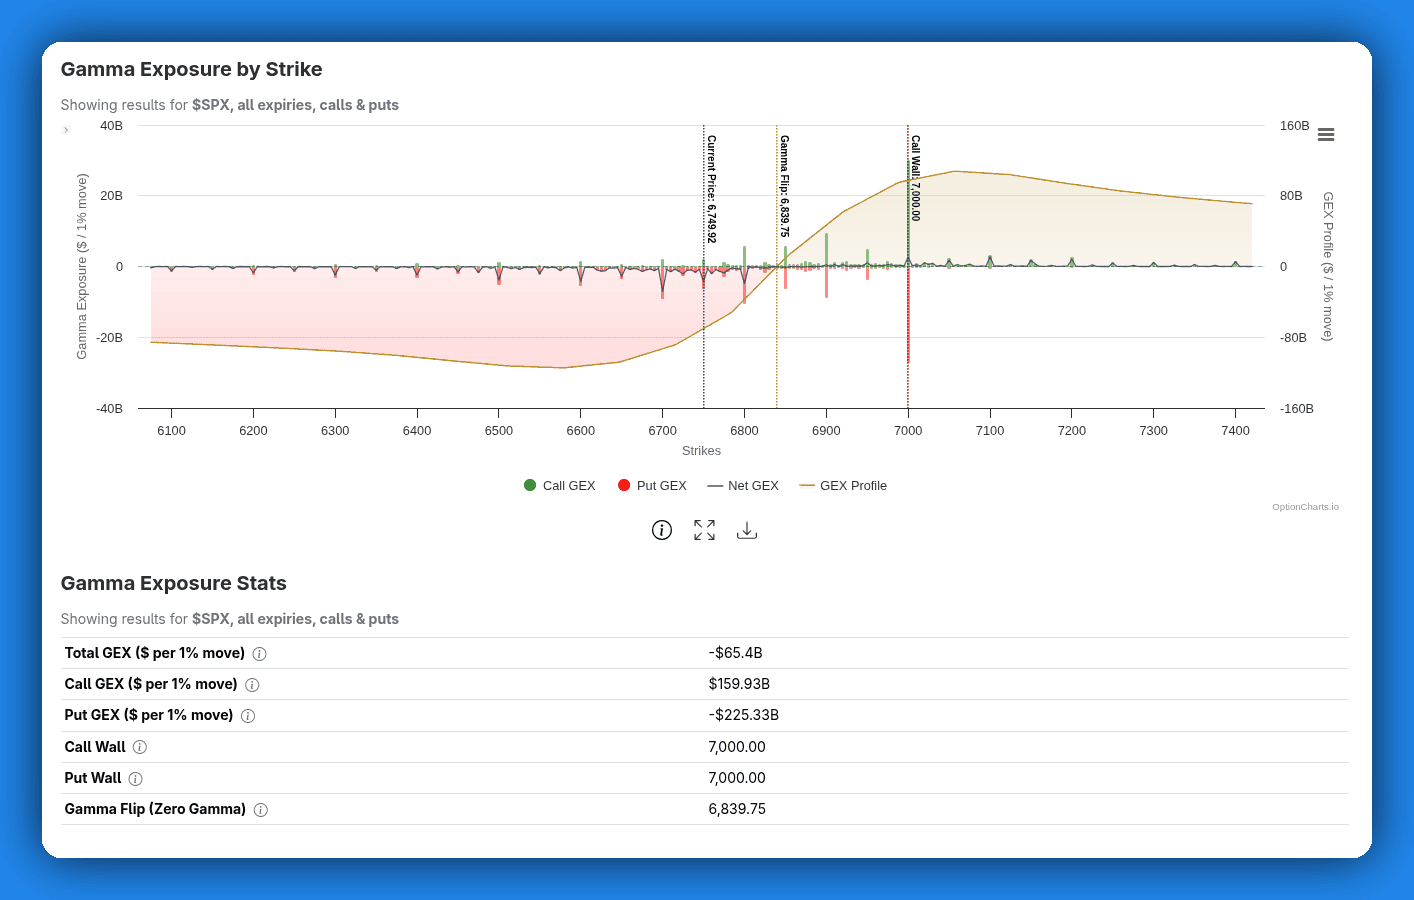
Call Wall & Put Wall
The Call Wall is the strike with the highest call gamma. Because dealers are heavily hedged at this strike, it tends to act as resistance. Price approaching the call wall often slows down or reverses.
The Put Wall is the same idea on the downside: the strike with the highest put gamma, which acts as support.
Both now appear as labeled vertical lines on the chart, with exact strike values shown in the stats table below.
Gamma Profile
The Gamma Profile is a curve showing modeled dealer gamma across a range of hypothetical spot prices. Instead of just seeing gamma at current strikes, you can see how the gamma picture shifts if the underlying moves up or down.
It renders as a line overlay with its own Y-axis, so it doesn't interfere with the bar chart. The Gamma Flip level is derived from where this curve crosses zero.
Gamma Flip (Zero Gamma Level)
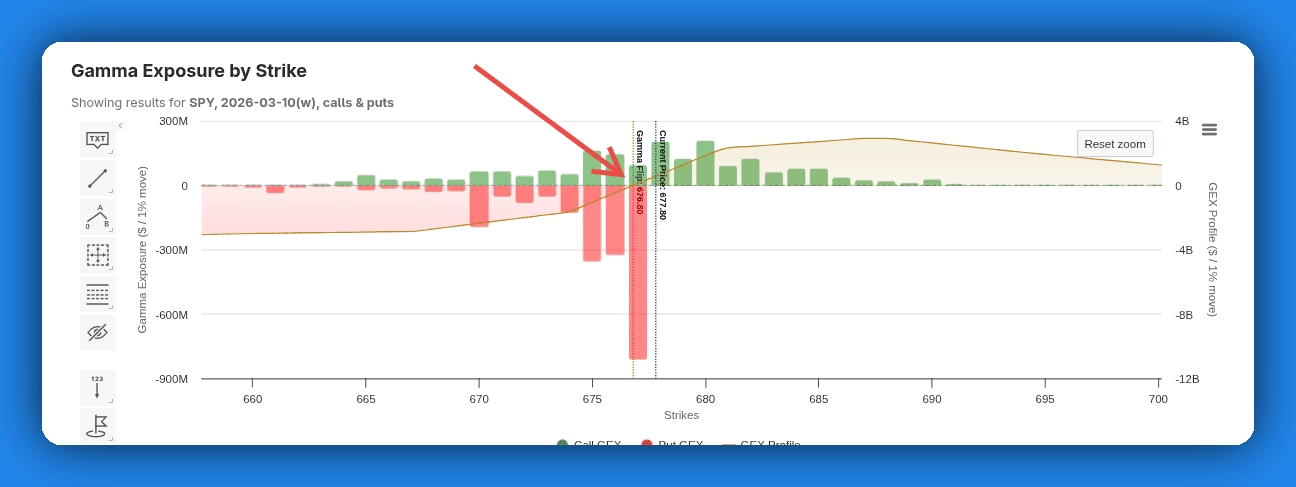
The Gamma Flip is where the gamma profile crosses from negative to positive. Above this level, dealer hedging dampens volatility. Below it, hedging amplifies volatility.
This is the line that tells you whether the market is in a "calm" or "volatile" regime. It's calculated using a full Black-Scholes simulation across all strikes and expirations, not a simple approximation.
It appears as a vertical indicator on the chart with the exact strike shown in the stats table.
Combined Chart View
Previously, net GEX and call/put GEX were two separate charts containing redundant information. You had to scroll between them.
Now it's a single chart. You can switch between a net GEX view and a call/put GEX view using the indicators drop down menu.
GEX by Expiration Data Table
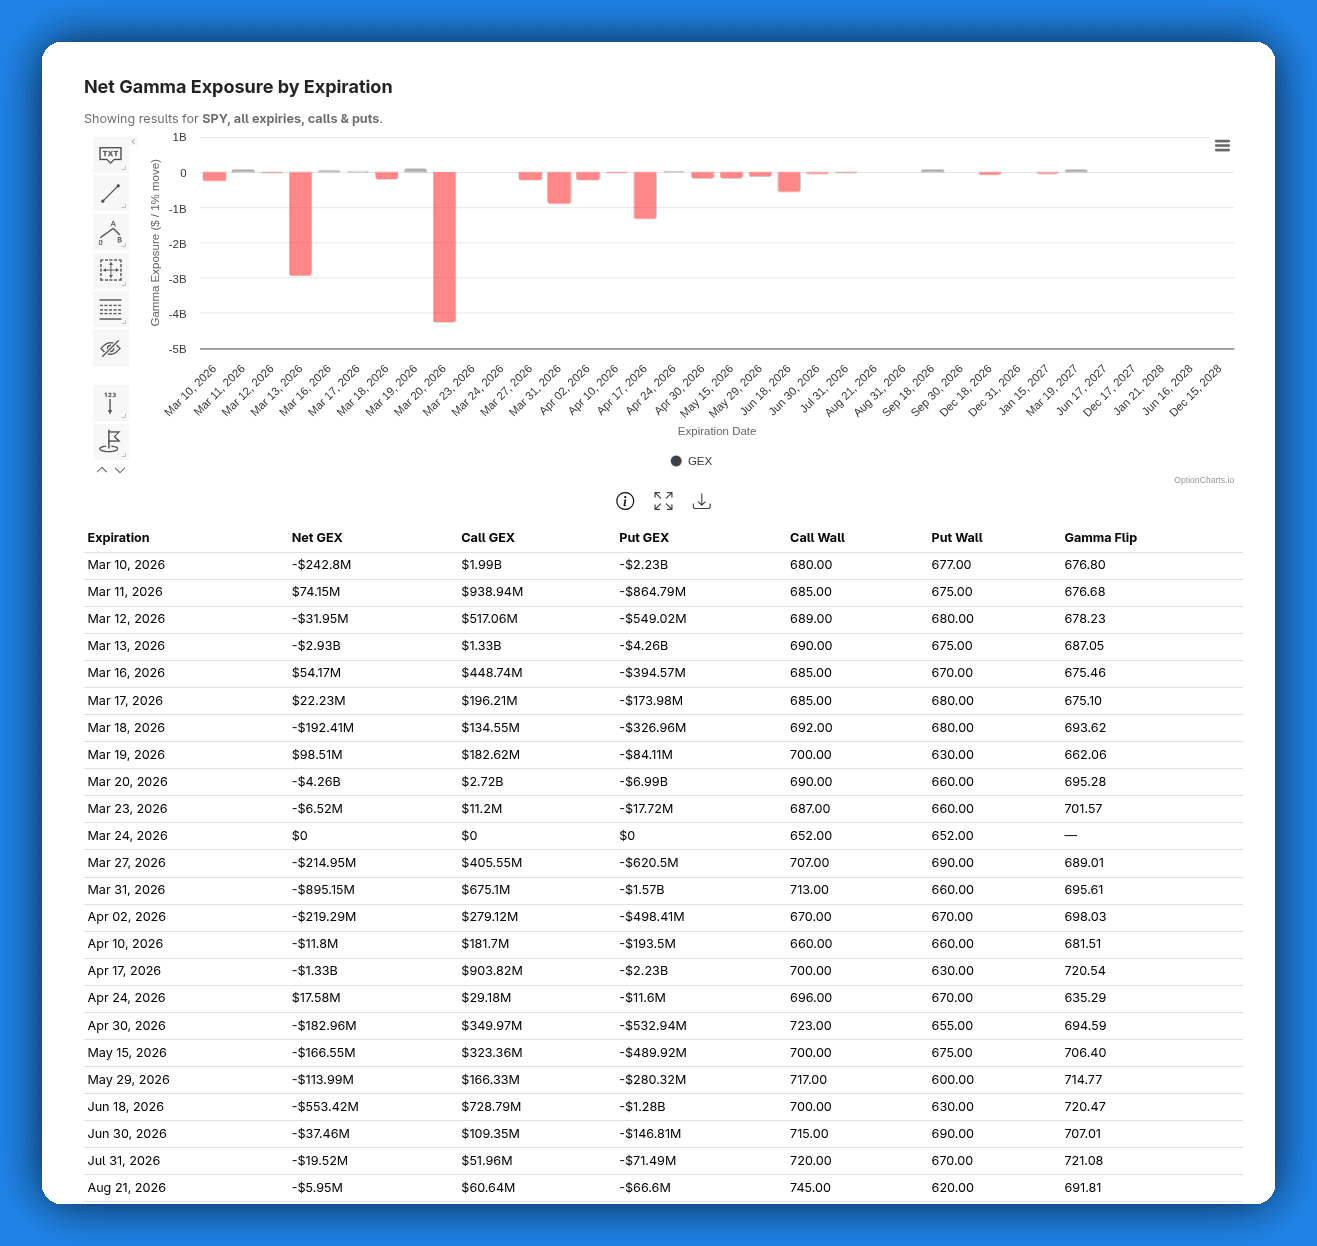
Below the "Net Gamma Exposure by Expiration" chart, there's now a data table showing Net GEX, Call GEX, Put GEX, Call Wall, Put Wall, and Gamma Flip for each expiration date. Click any row to jump to that expiration's detailed view.
Indicator Dropdown
Not everyone wants every indicator on screen at once. The new Indicators dropdown lets you check or uncheck individual indicators (Call Wall, Put Wall, Gamma Flip, Gamma Profile, Net GEX). Your selection preferences are saved and persist across page loads.
Stats Table with Tooltips
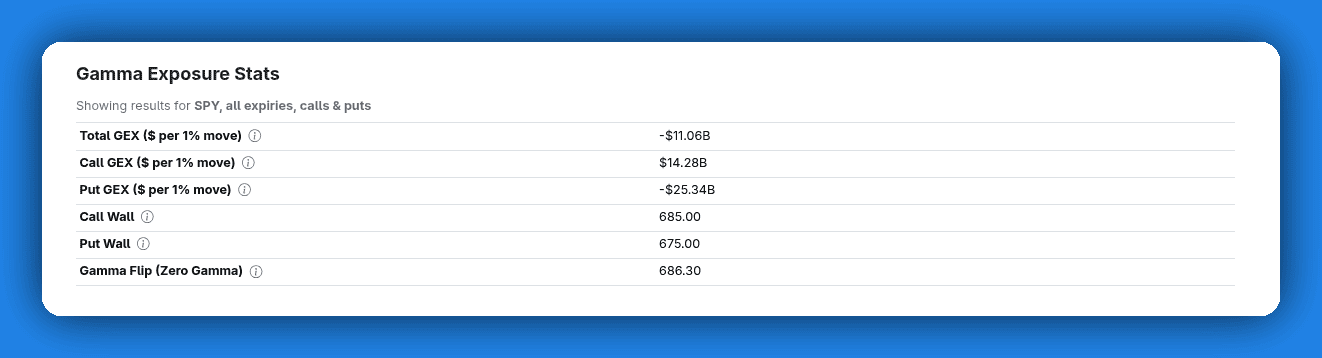
The stats summary now shows all key levels with their exact values. Each metric has a tooltip explaining what it means, so you don't have to remember the definitions.
DEX Charts Too
Every improvement above also applies to the Delta Exposure (DEX) charts: combined view, call/put walls, indicator dropdown, data table, and stats tooltips.
Free Users: Basic GEX Is Now Available
Free users can now view Call GEX and Put GEX bars for a single expiry at a time.
Premium subscribers get all indicators (Net GEX, Call Wall, Put Wall, Gamma Flip, Gamma Profile) and access to all expiration dates. If you've been curious about gamma exposure but haven't upgraded yet, you can now explore the chart and see real data.
What's Next
These indicators give you a snapshot of the current gamma picture. We're working toward integrating these indicators into historical charts too, so you can see how call walls, gamma flips, and the overall gamma profile have shifted over time.
Try it out and tell us what you think.
The GEX and DEX chart updates are live now. Open any ticker's Gamma Exposure page to try them out.
Want the full picture? Upgrade to get Call Wall, Put Wall, Gamma Flip, Gamma Profile, and access to all expiration dates.