Getting Started
Welcome! This guide will give you a quick introduction to navigating OptionCharts and using our tools for options analysis and research.
What is OptionCharts?
OptionCharts provides charts and tools designed specifically for options traders. Our mission is to help you gain insights into the options market and make more informed trading decisions. Whether you're new to options or an experienced trader, our platform offers valuable resources to enhance your understanding and improve your trading outcomes. OptionCharts achieves this by providing unique data and insights into the options market, presented through user-friendly charts and visuals.
Quickstart
Start by browsing our charts to get familiar with our platform and the types of data we offer. Try out different charts and tools to see which ones are most helpful for your trading style.
Searching and Viewing Options for a Ticker
You can search for options data for specific tickers by using our search feature. Simply click the search icon in the top navigation bar and enter the ticker symbol or company name of the security you're interested in.
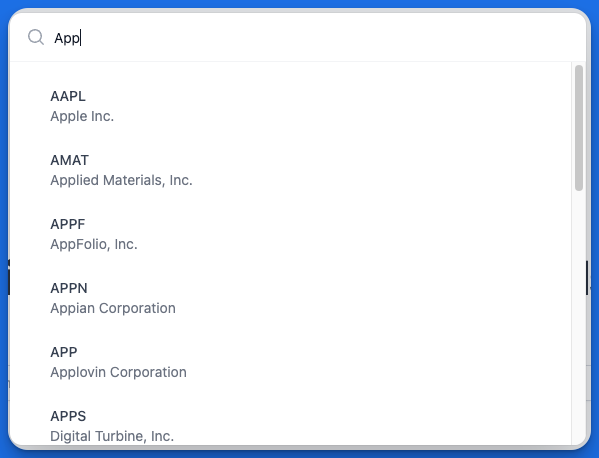
search by ticker or company name
For quick access to the search feature, use the keyboard shortcut Cmd + K (Mac) or Ctrl + K (Windows).
Creating an Account and Upgrading
You can use OptionCharts for free with basic features. We offer two paid plans:
- Premium: Access all charts and data, plus premium features such as data downloads, full-screen charts, and more.
- Ultimate: Everything in Premium plus real-time options data.
Navigating Option Charts
Market Trends
Use Market Trends to view which tickers and option contracts are trending based on highest option volume, open interest, or unusual activity. This tool enables you to quickly analyze the options market and spot potential trade ideas.
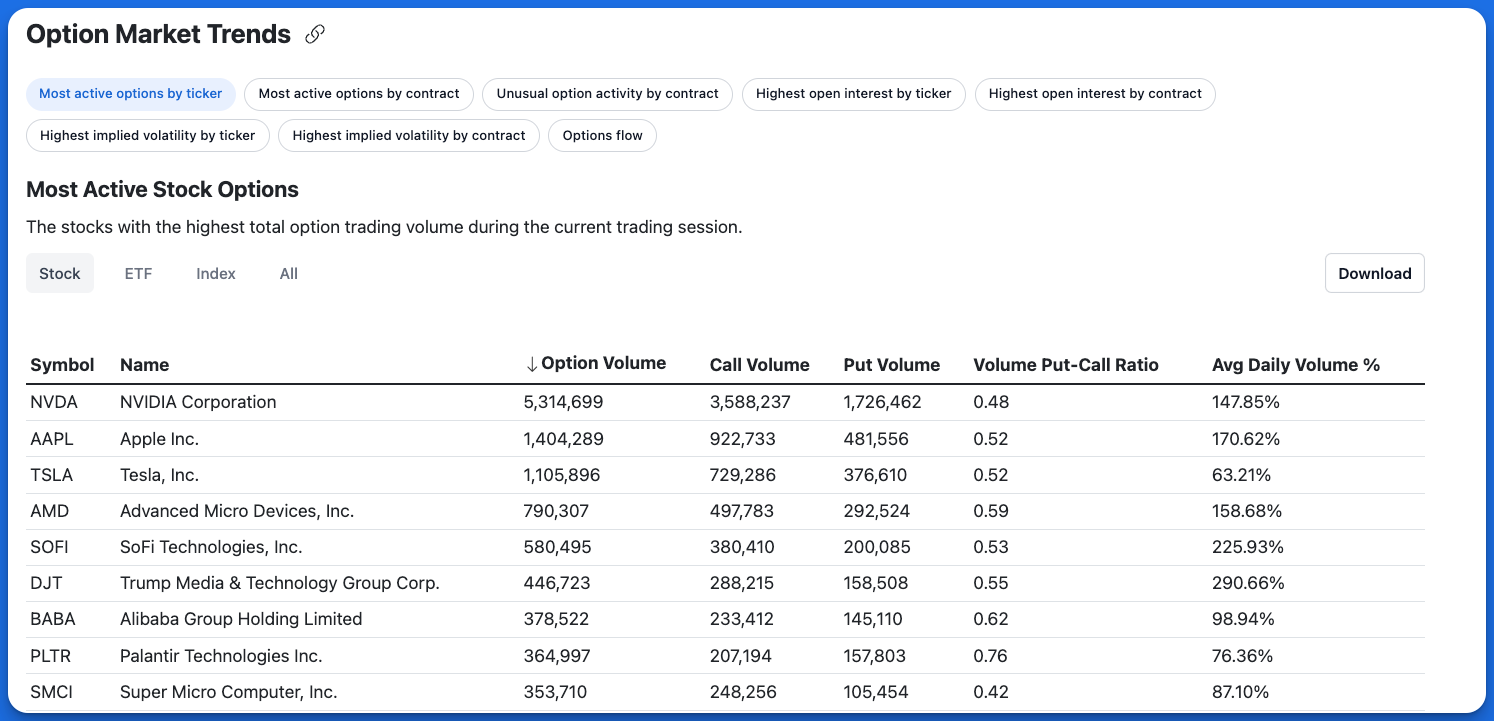
market trends
Ticker Overview
OptionCharts provides option analytics and charts for every optionable security. Each ticker view is organized into the following structure:
-
Overview: A comprehensive snapshot of the security featuring price history charts, company profile, and aggregated options statistics.
-
Profit and Loss Chart: Interactive risk graphs that visualize potential profit and loss outcomes for various option strategies, helping you assess risk-reward scenarios before executing trades.
-
Option Charts: Visualizations for options across one or more expiration dates, including:
- Open Interest: Total outstanding contracts at each strike price, revealing market positioning and support/resistance levels
- Volume: Total option volume at each strike price
- Max Pain: The theoretical price point where option buyers would experience maximum losses, based on max pain theory
- Volatility Skew: Implied volatility distribution across strikes
- Probability Distribution: Statistical likelihood of various price outcomes calculated using Black-Scholes modeling and current option prices
- Greeks (Delta, Gamma, Theta, Vega): Complete options Greeks analysis across the entire option chain
- Unusual Options: Abnormal trading activity highlighted by volume-to-open interest ratios
- Gamma Exposure (GEX): Estimated dollar hedging required by market makers per 1% underlying move to maintain gamma neutrality
- Delta Exposure (DEX): Estimated dollar hedging required by market makers per 1% underlying move to maintain delta neutrality
-
Option Chain: Lists all available option contracts for a given security at various strike prices and expiration dates in a table format.
-
Option Contract: Detailed analysis of individual option contracts including bid/ask price, volume, open interest, Greeks, and option price history.
-
Historical Data: Historical option statistics for the security. View past options data by date across key option metrics such as option volume, put-call ratios, implied volatility, and more.
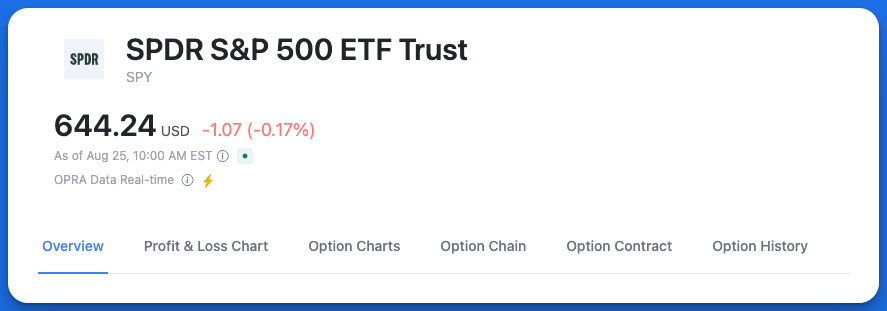
Ticker tab layout
Features
Learn more about some of the core features OptionCharts provides: