Understanding The Profit and Loss Chart in Options Trading
The Option Profit and Loss Chart (P&L) helps traders evaluate potential outcomes of option trades by displaying the theoretical profit and loss of a strategy at different underlying prices.

What is the Option Profit and Loss Charts?
The Option Profit and Loss Chart provides option investors with a graph of the potential profit and loss outcomes for an options trade. Use this chart to quickly visualize how changes in the underlying asset's price impact your potential profit or loss. The chart can be used to illustrate profit and loss for both simple single-leg strategies and complex multi-legged strategies. Add, remove, or modify option legs to customize this chart and align with your investment goals and risk tolerance.
The Option Profit and Loss Chart is known by several different names in the world of option trading. Depending on the context and the platform, you may hear it referred to as the Option Payoff Diagram, Option Risk Graph, Profit Graph, Option Profit Calculator, or Option Strategy Chart.
Why Use the Profit and Loss Chart?
The Profit and Loss chart is essential for options traders because it provides a visual representation of potential trade outcomes, leading to better-informed trading decisions. Here's why using the P&L chart is beneficial:
- Visualize Outcomes: The chart displays the theoretical profit and loss of a strategy at various underlying asset prices, making it easy to understand potential gains or losses. The vertical (Y-axis) represents profit and loss, while the horizontal (X-axis) shows the stock price at expiration.
- Assess Risk and Reward: It helps you understand the potential risk and reward, showing maximum profit, maximum loss, and breakeven points, crucial for aligning strategies with your risk tolerance.
- Analyze Time Decay and Volatility: The P&L chart illustrates how time decay impacts an option's value over time.
- Compare Strategies: It simplifies comparing different strategies side-by-side, helping you to choose those that best fit your goals and risk profile.
- Plan Trades Effectively: By visualizing potential outcomes and how time and volatility affect an option’s value, the chart helps you plan trades more effectively, answering questions about potential profit or loss, and breakeven prices.
Getting Started with the Option Profit and Loss Chart
1) Search for your ticker
In this example we'll use "SPY".
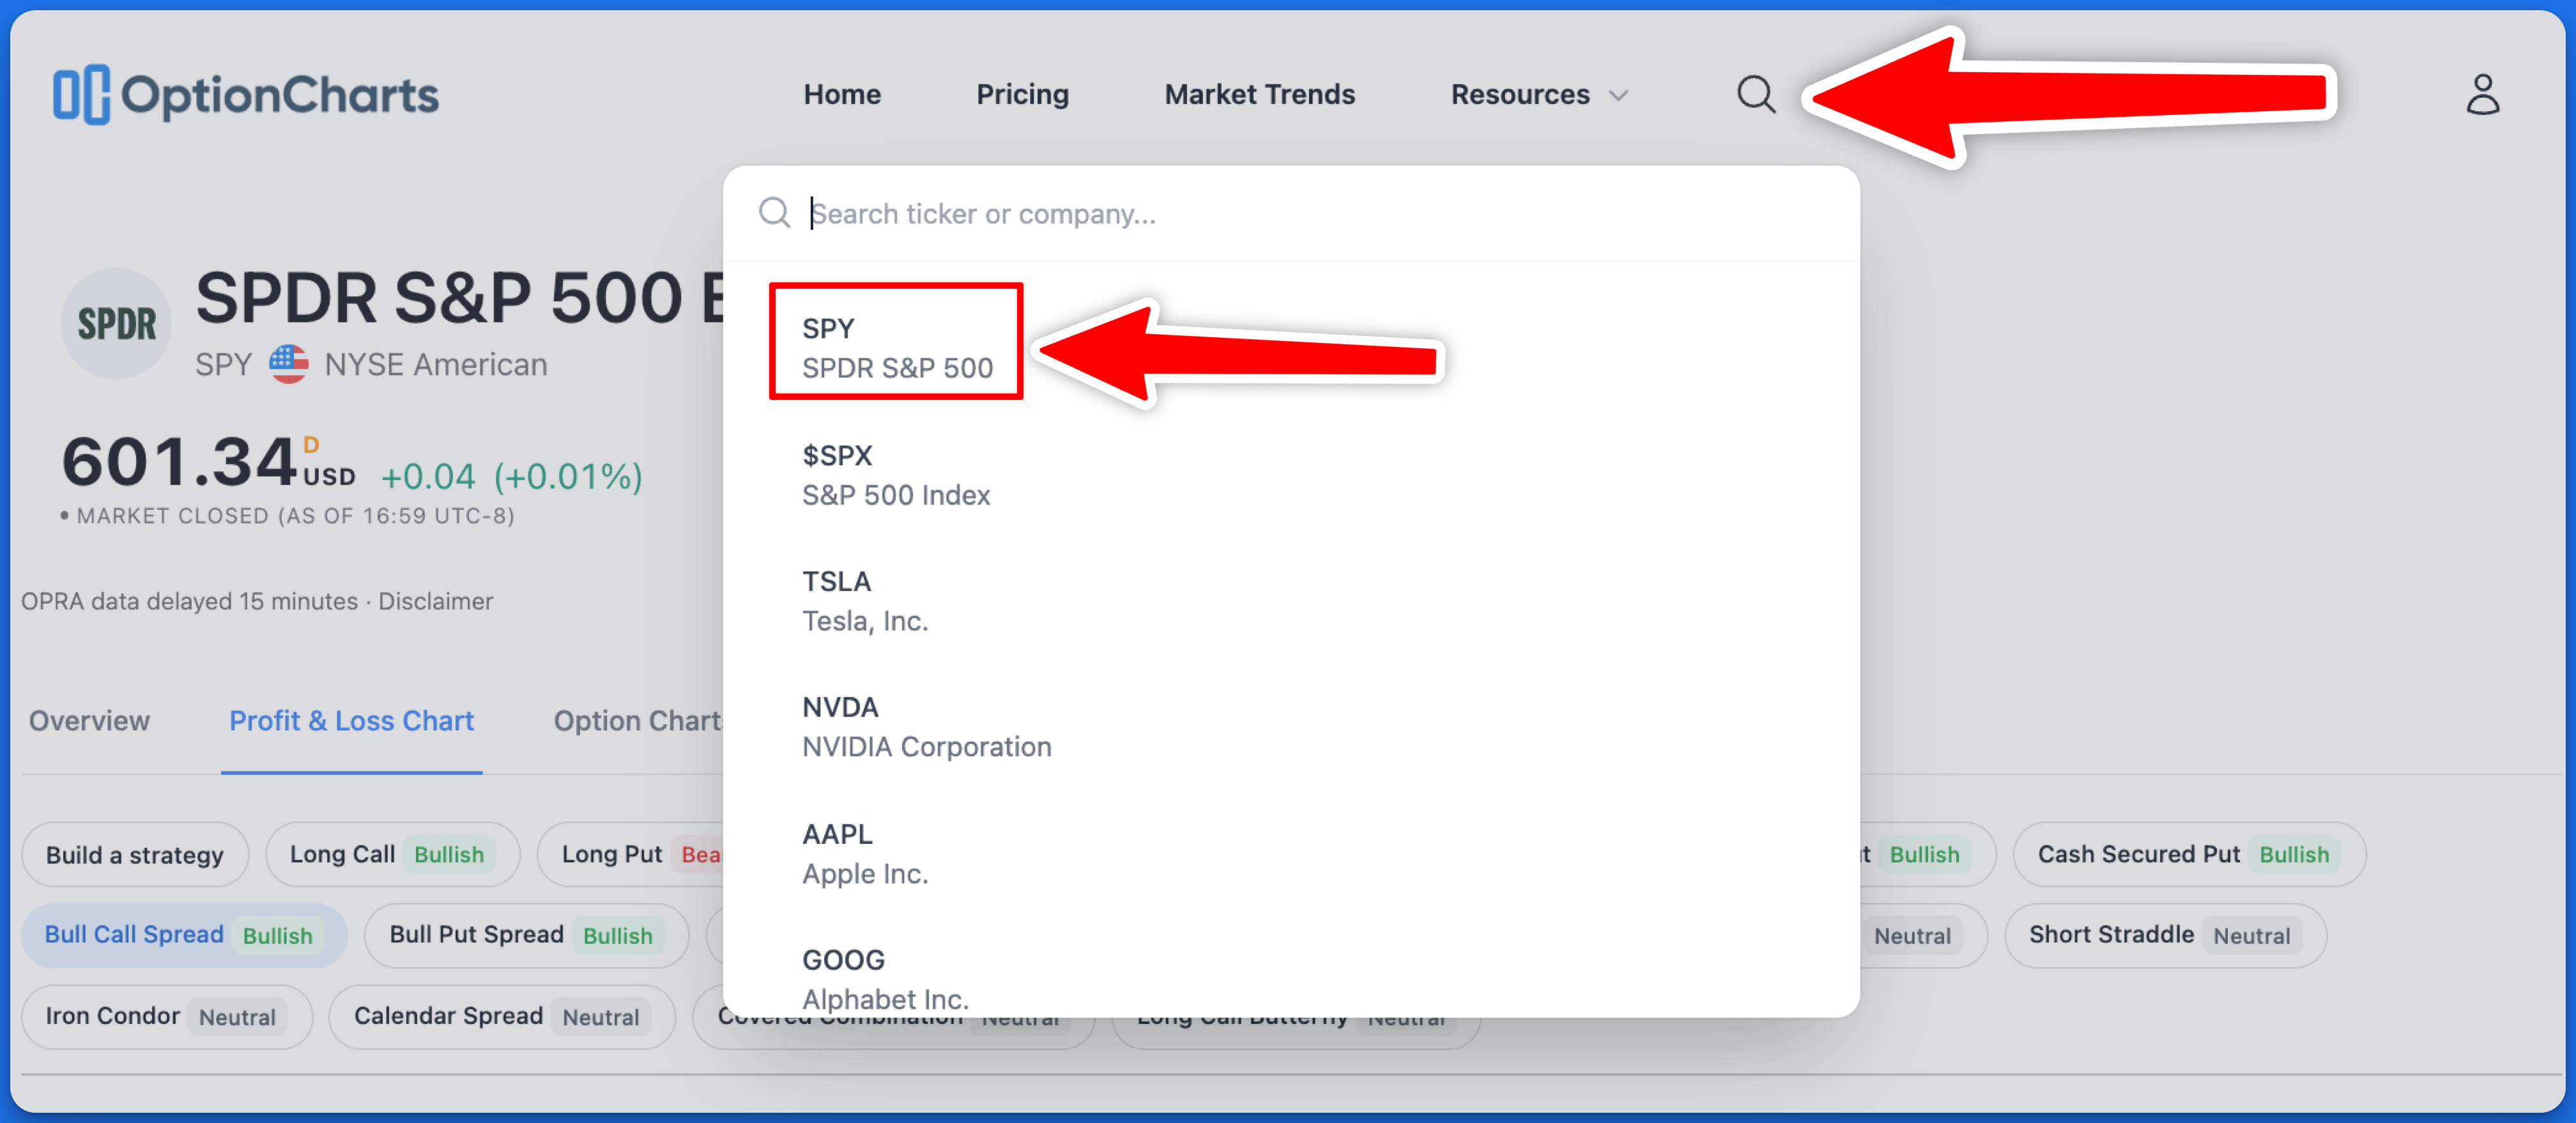
Searching for a ticker
2) Select the Profit and Loss Chart tab
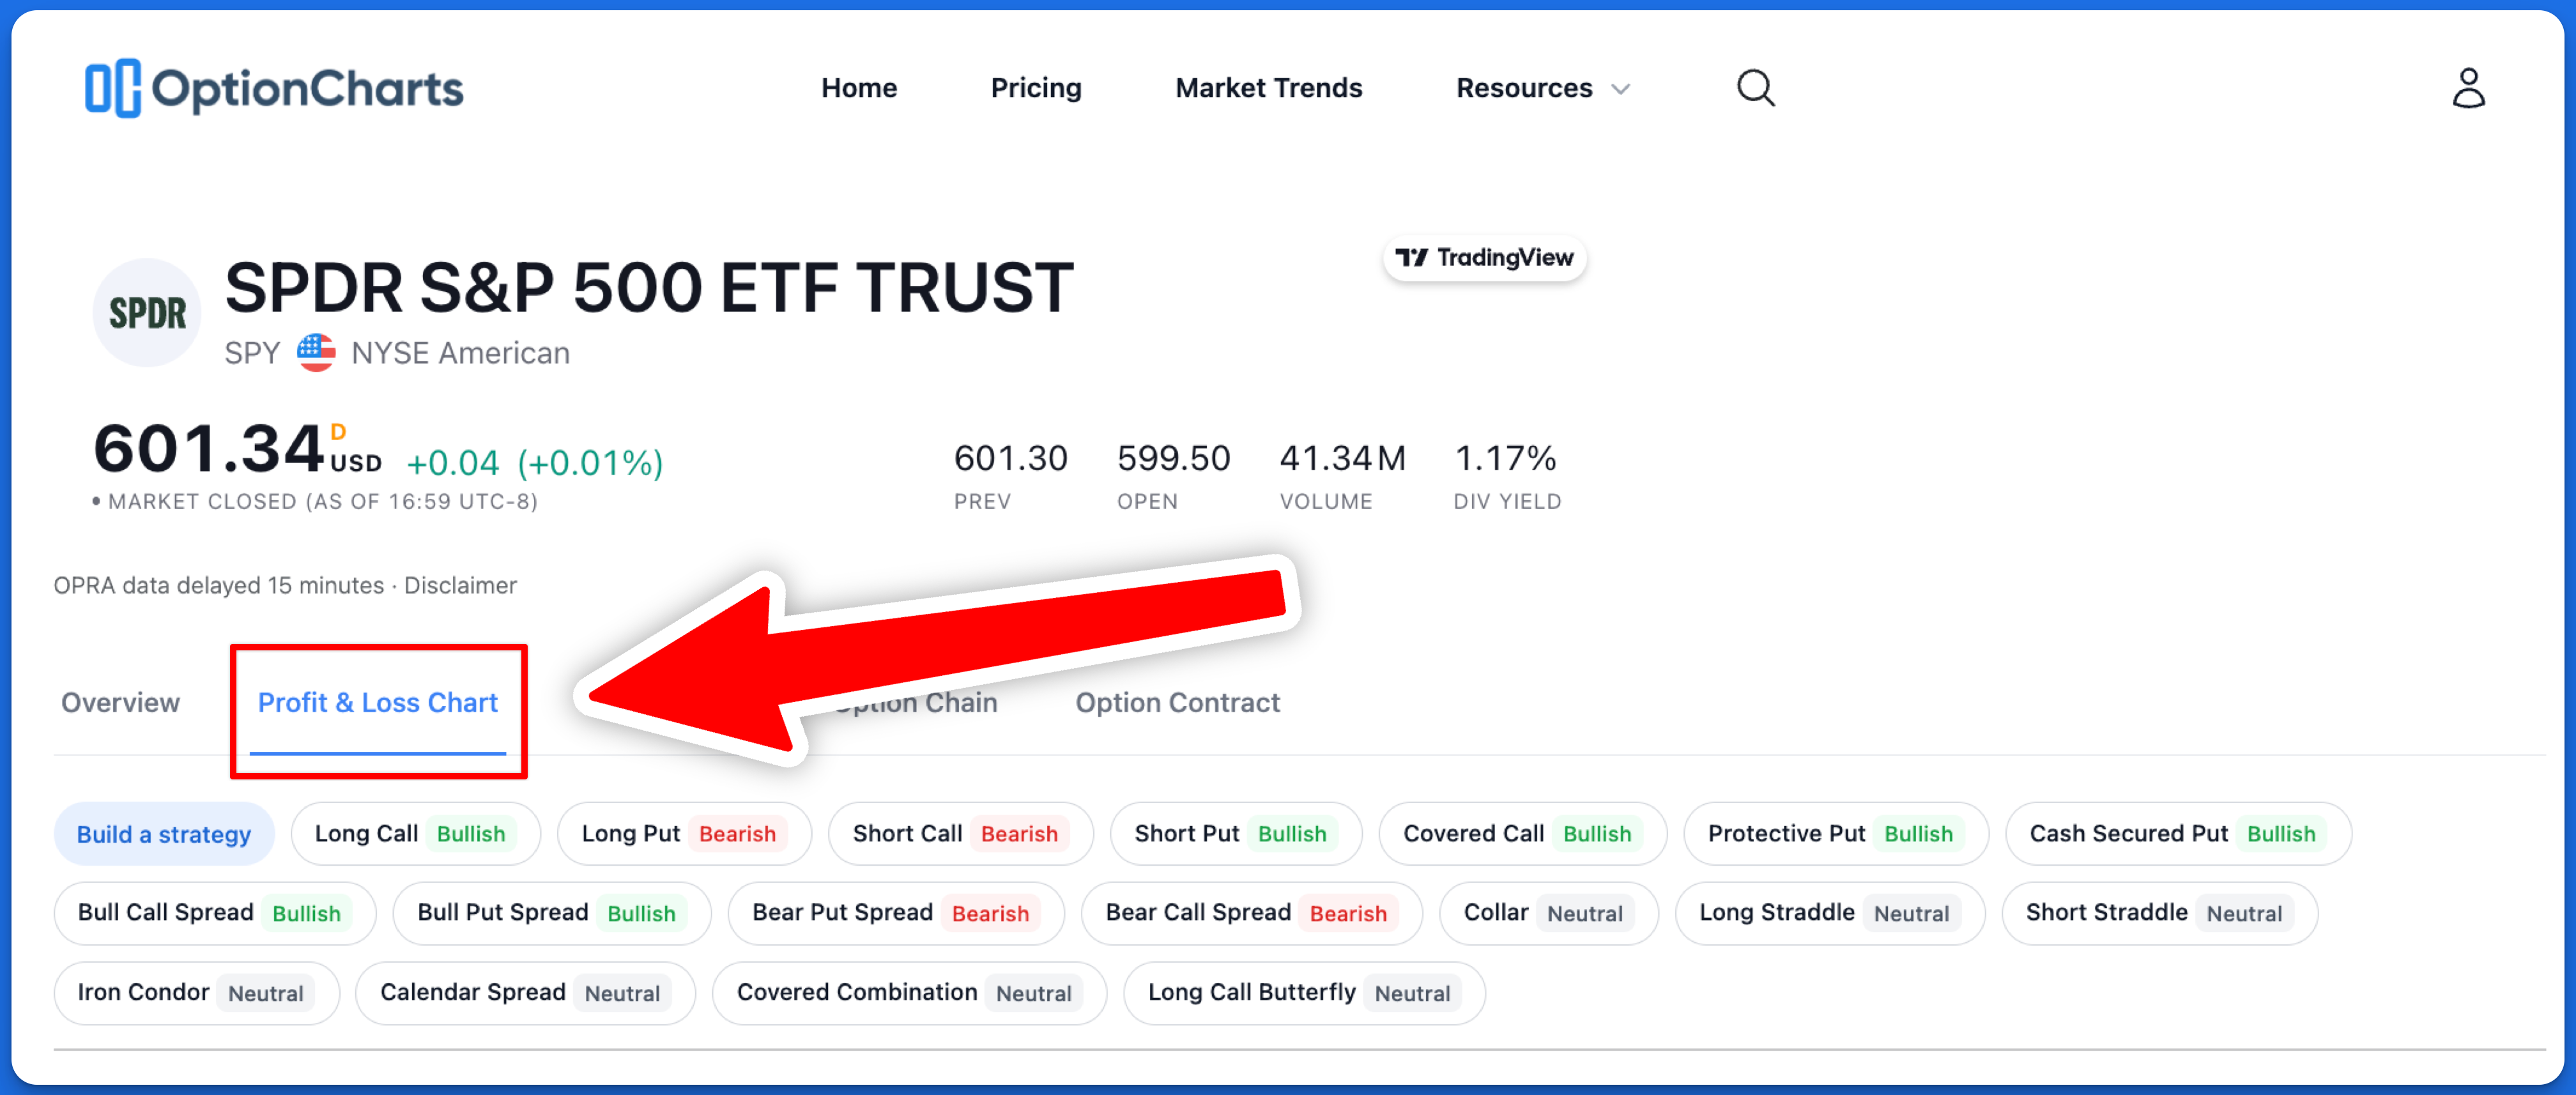
Profit and Loss Chart Tab
3) Select the desired trading strategy
For this example we'll select the "Bull Put Spread" strategy.
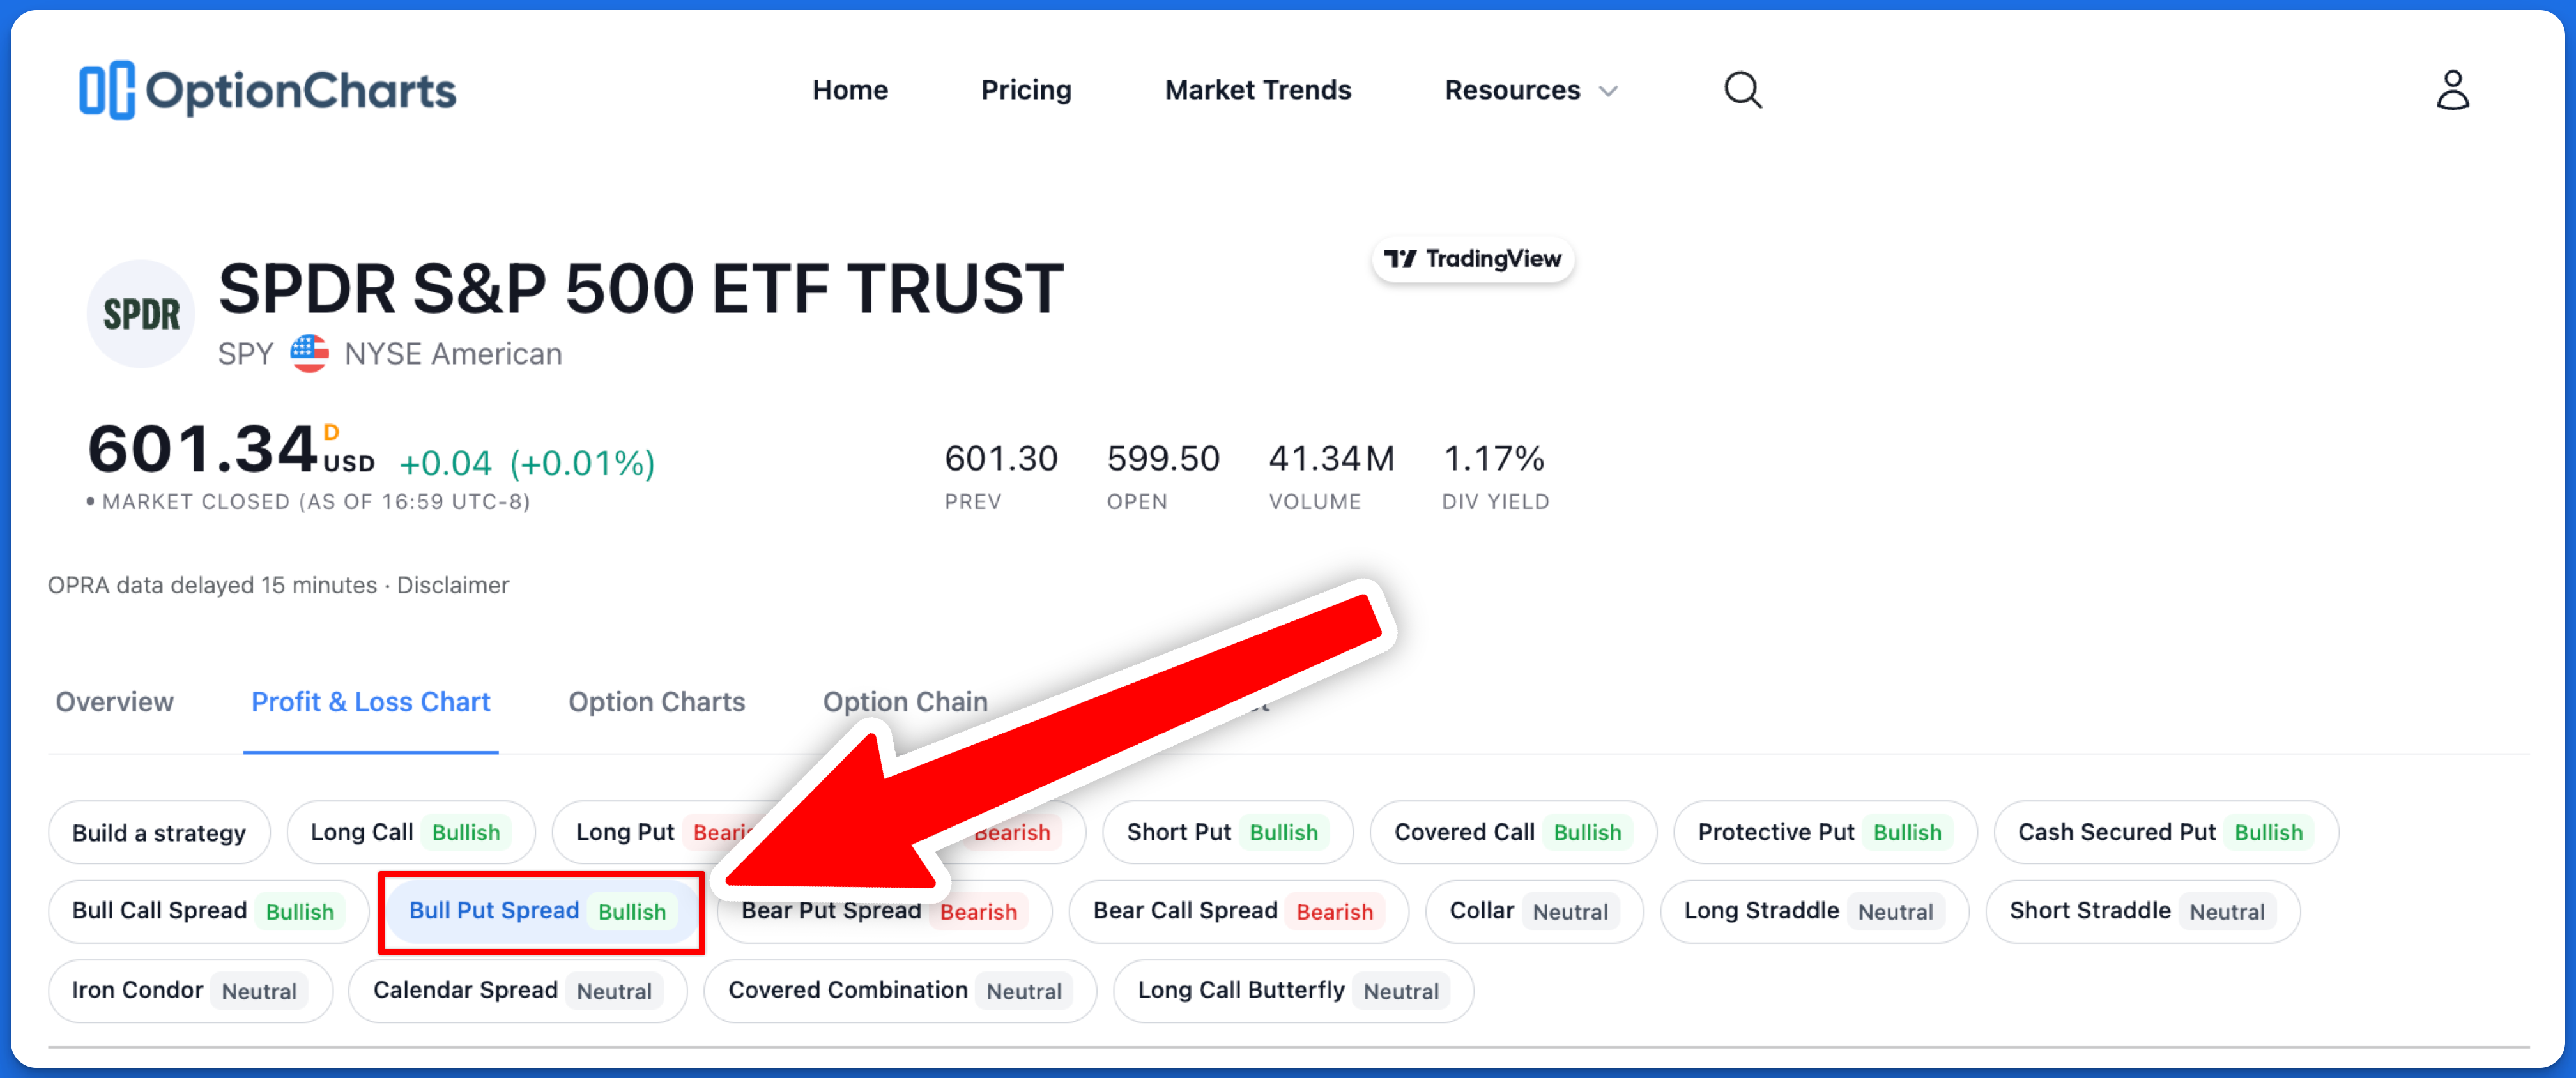
Choosing a pre-defined strategy
4) Adjust the legs of the trade
After picking the option strategy, by default, option legs that are loaded select the option that most closely matches a +/-30 delta and 30 days to expiry (DTE). This is used as a starting point, and users should adjust this based on their investment goals and risk tolerance.
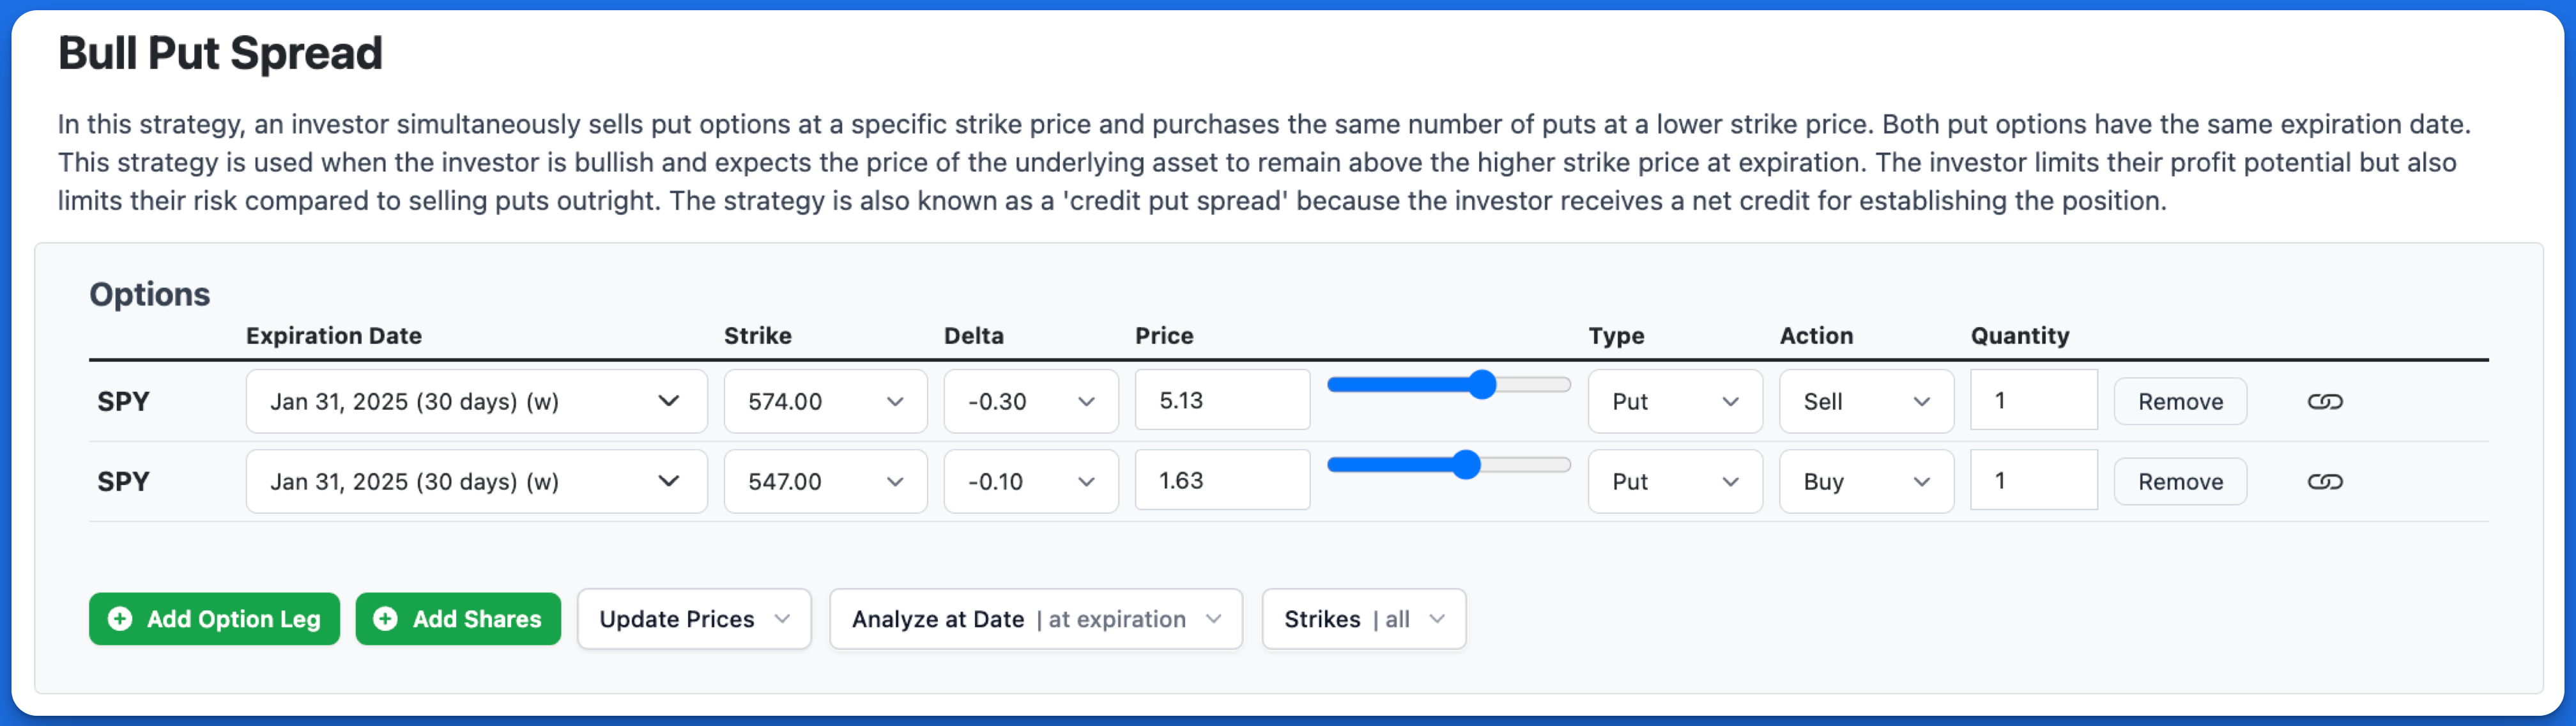
Illustration of a Bull Put Spread strategy with the Profit and Loss Chart.
5) View your chart and trade details
Your chart is ready, and you can now see your trade details.
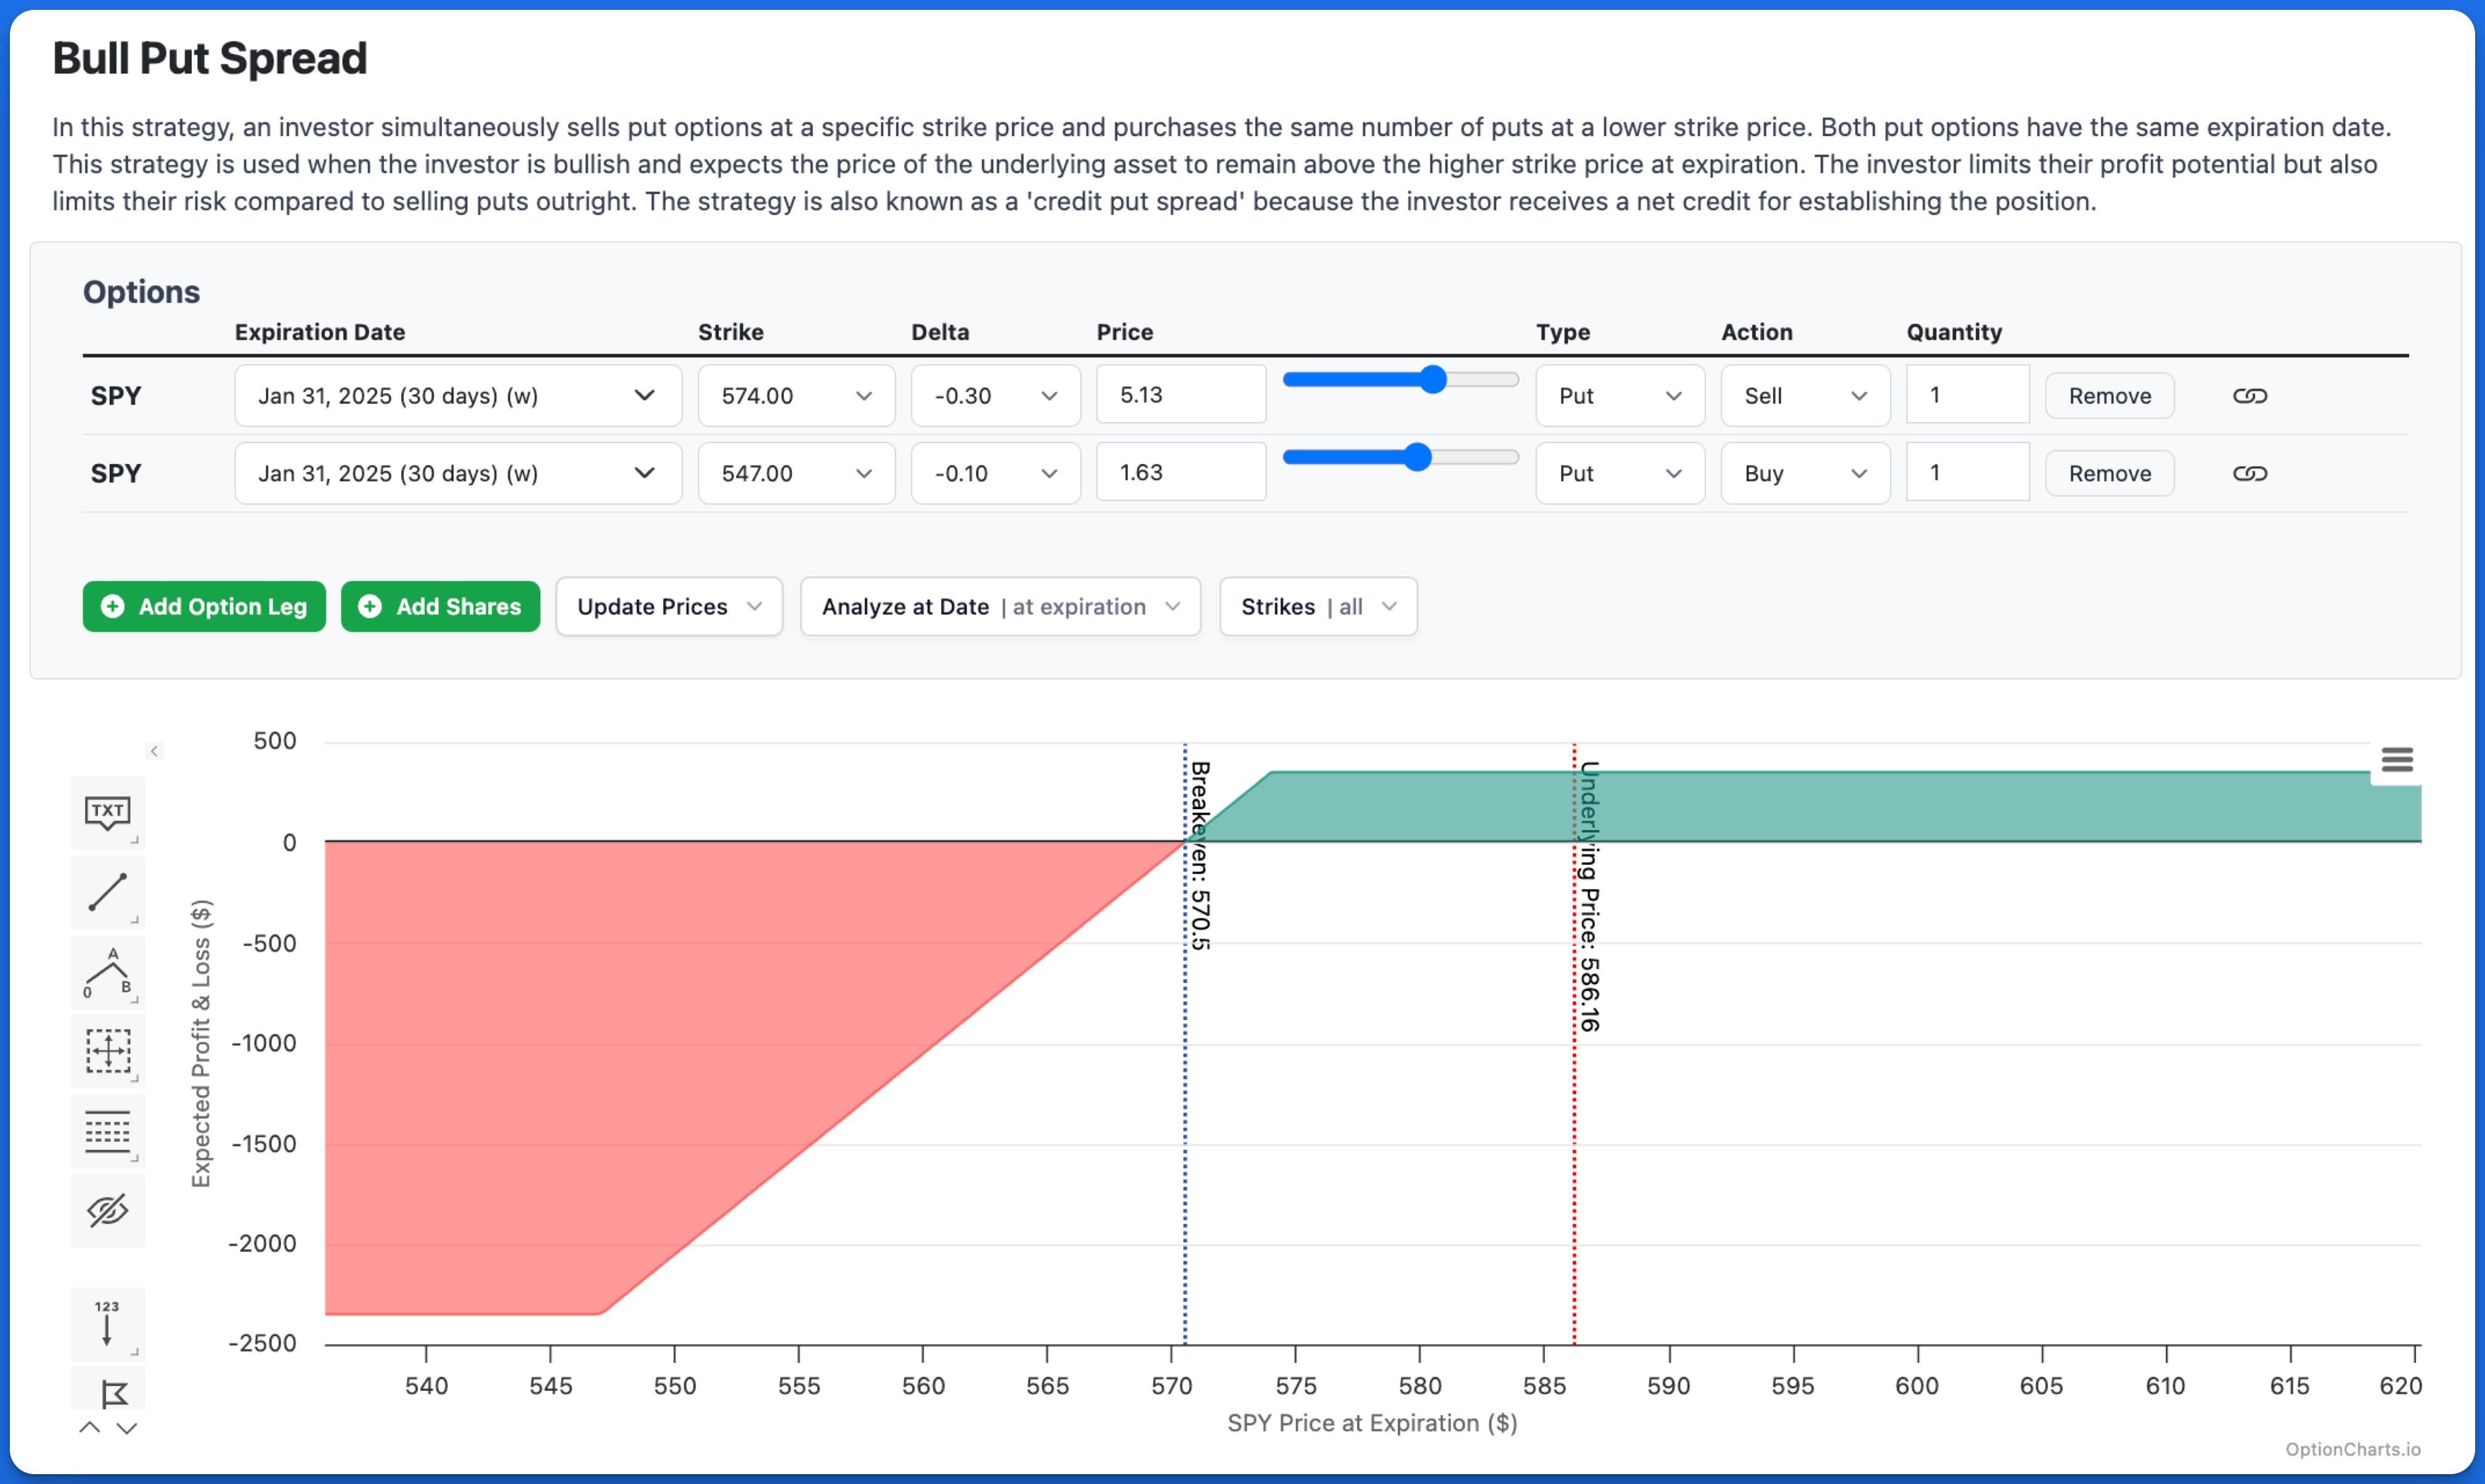
Illustration of the Profit and Loss Chart.
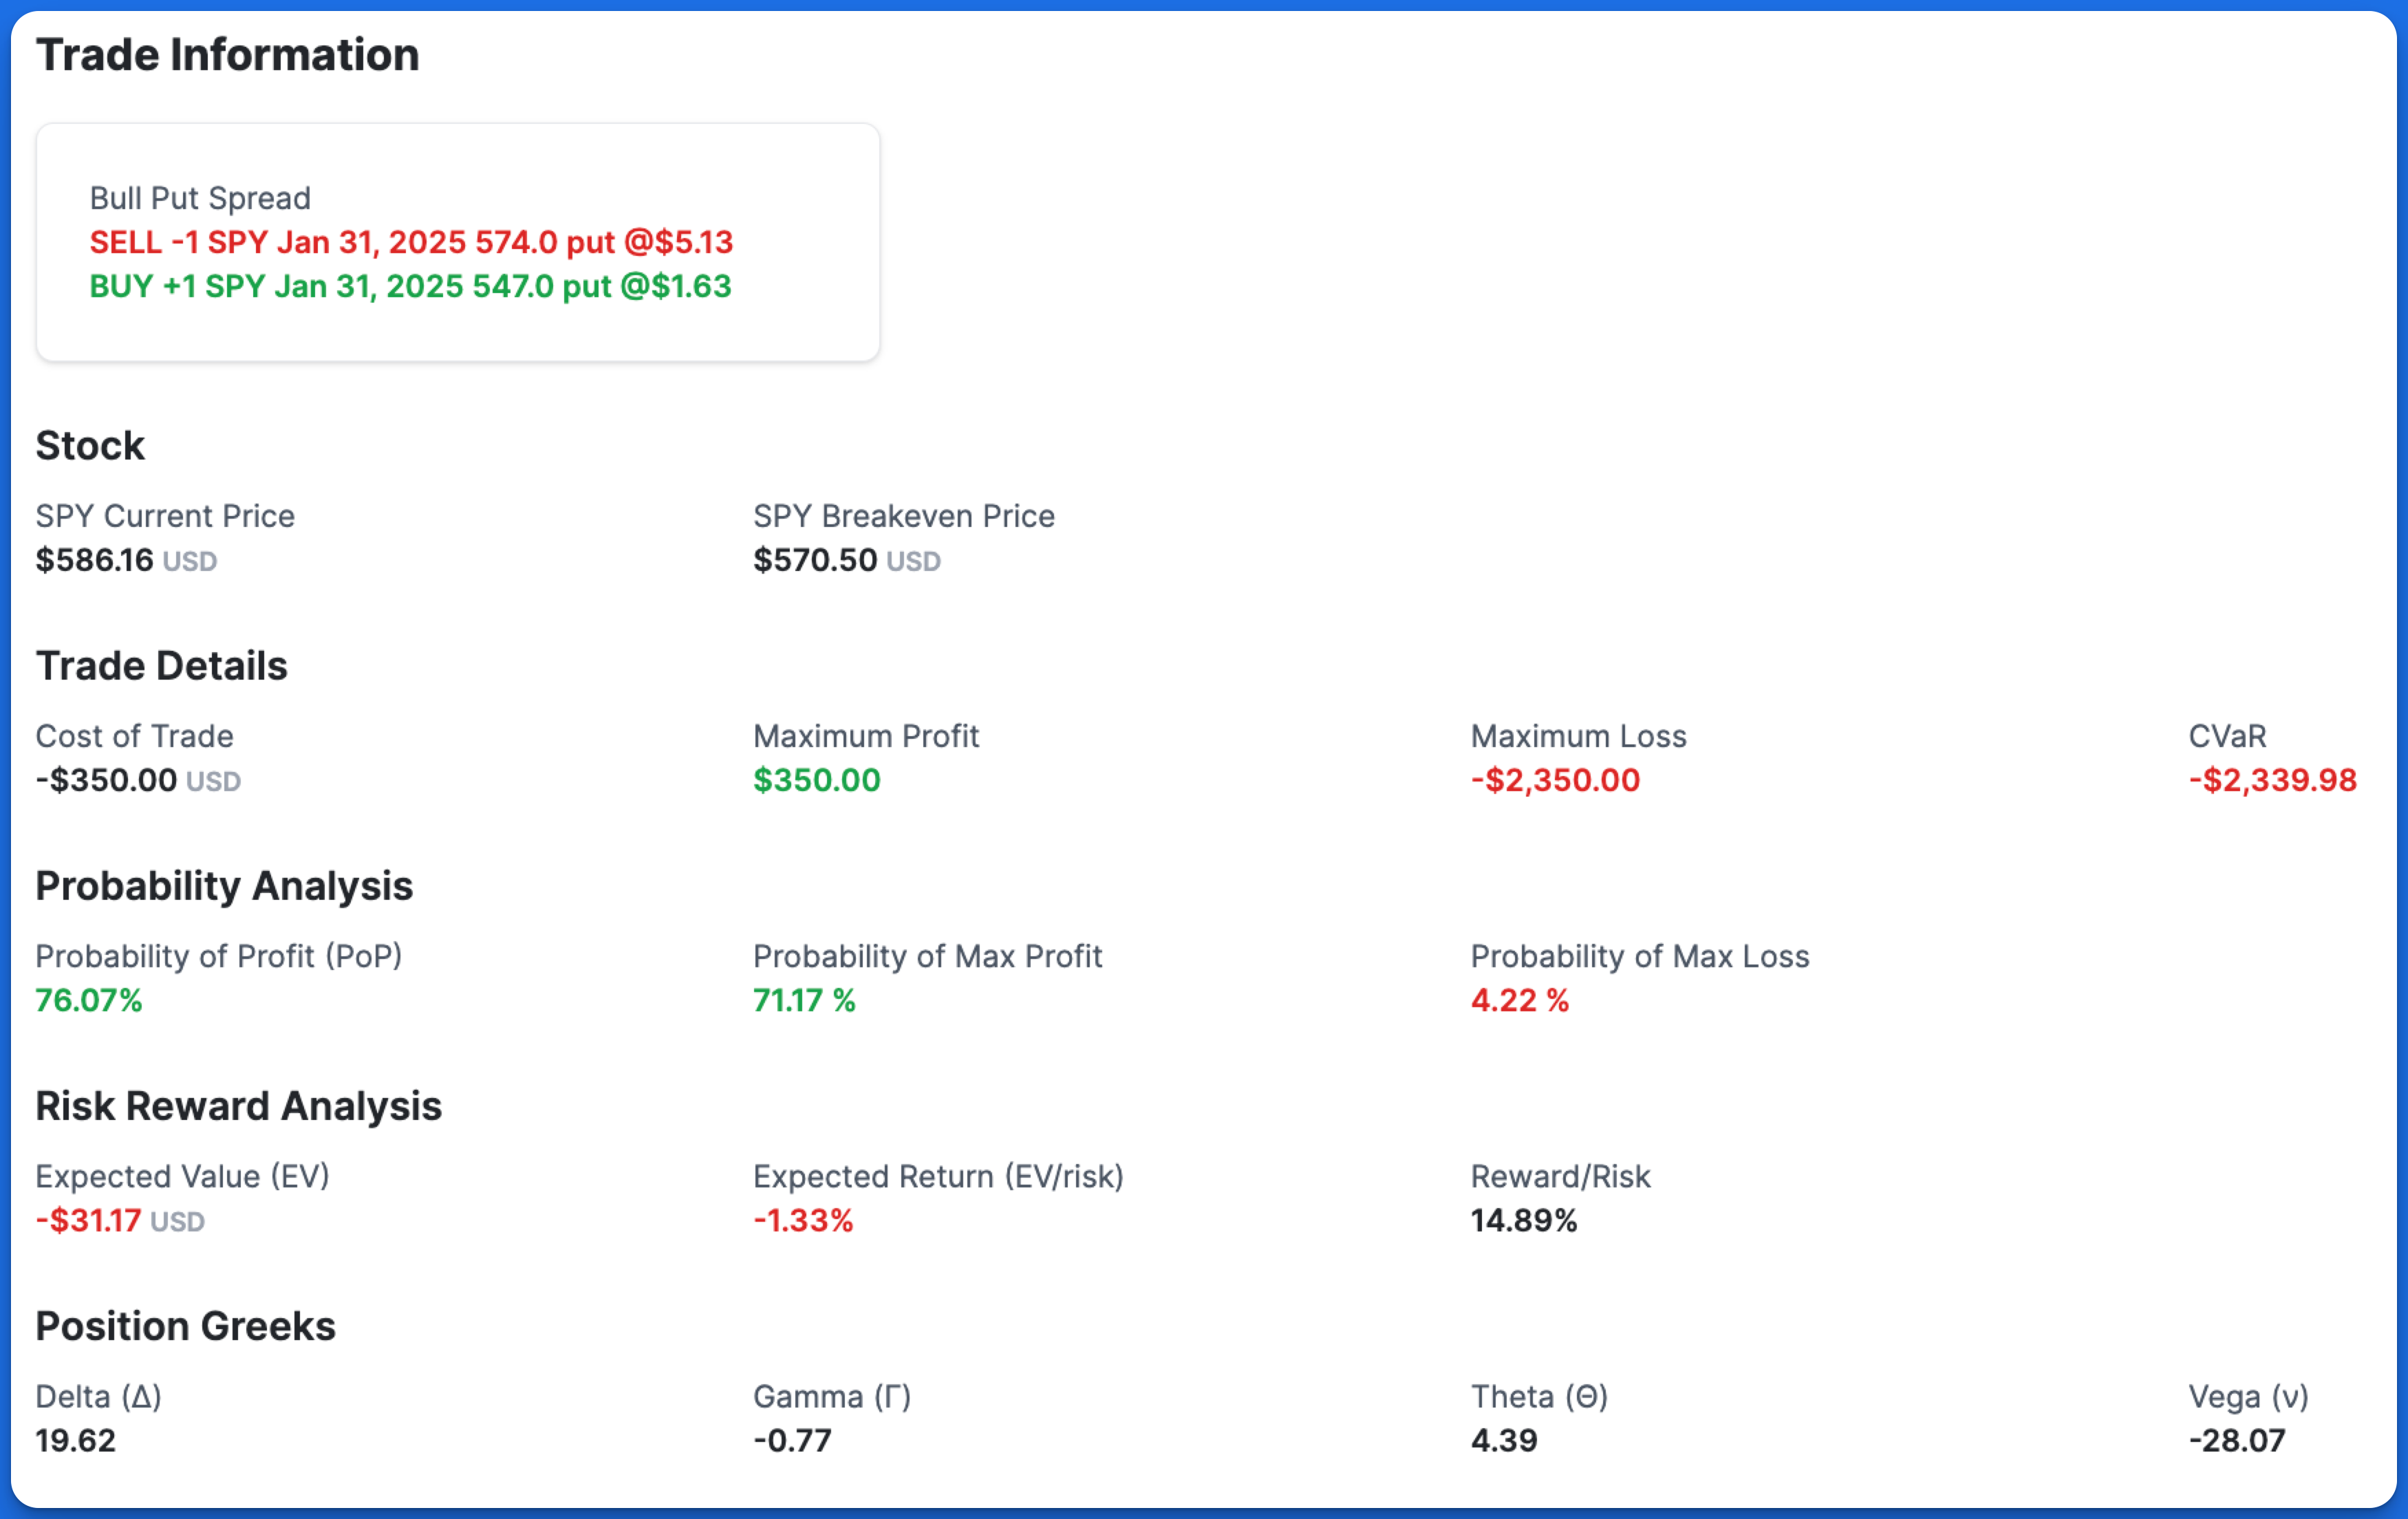
Illustration of the trade details on the Profit and Loss Chart.
Reading the chart
Let's break down the Profit and Loss chart into its components with a Long Call example.
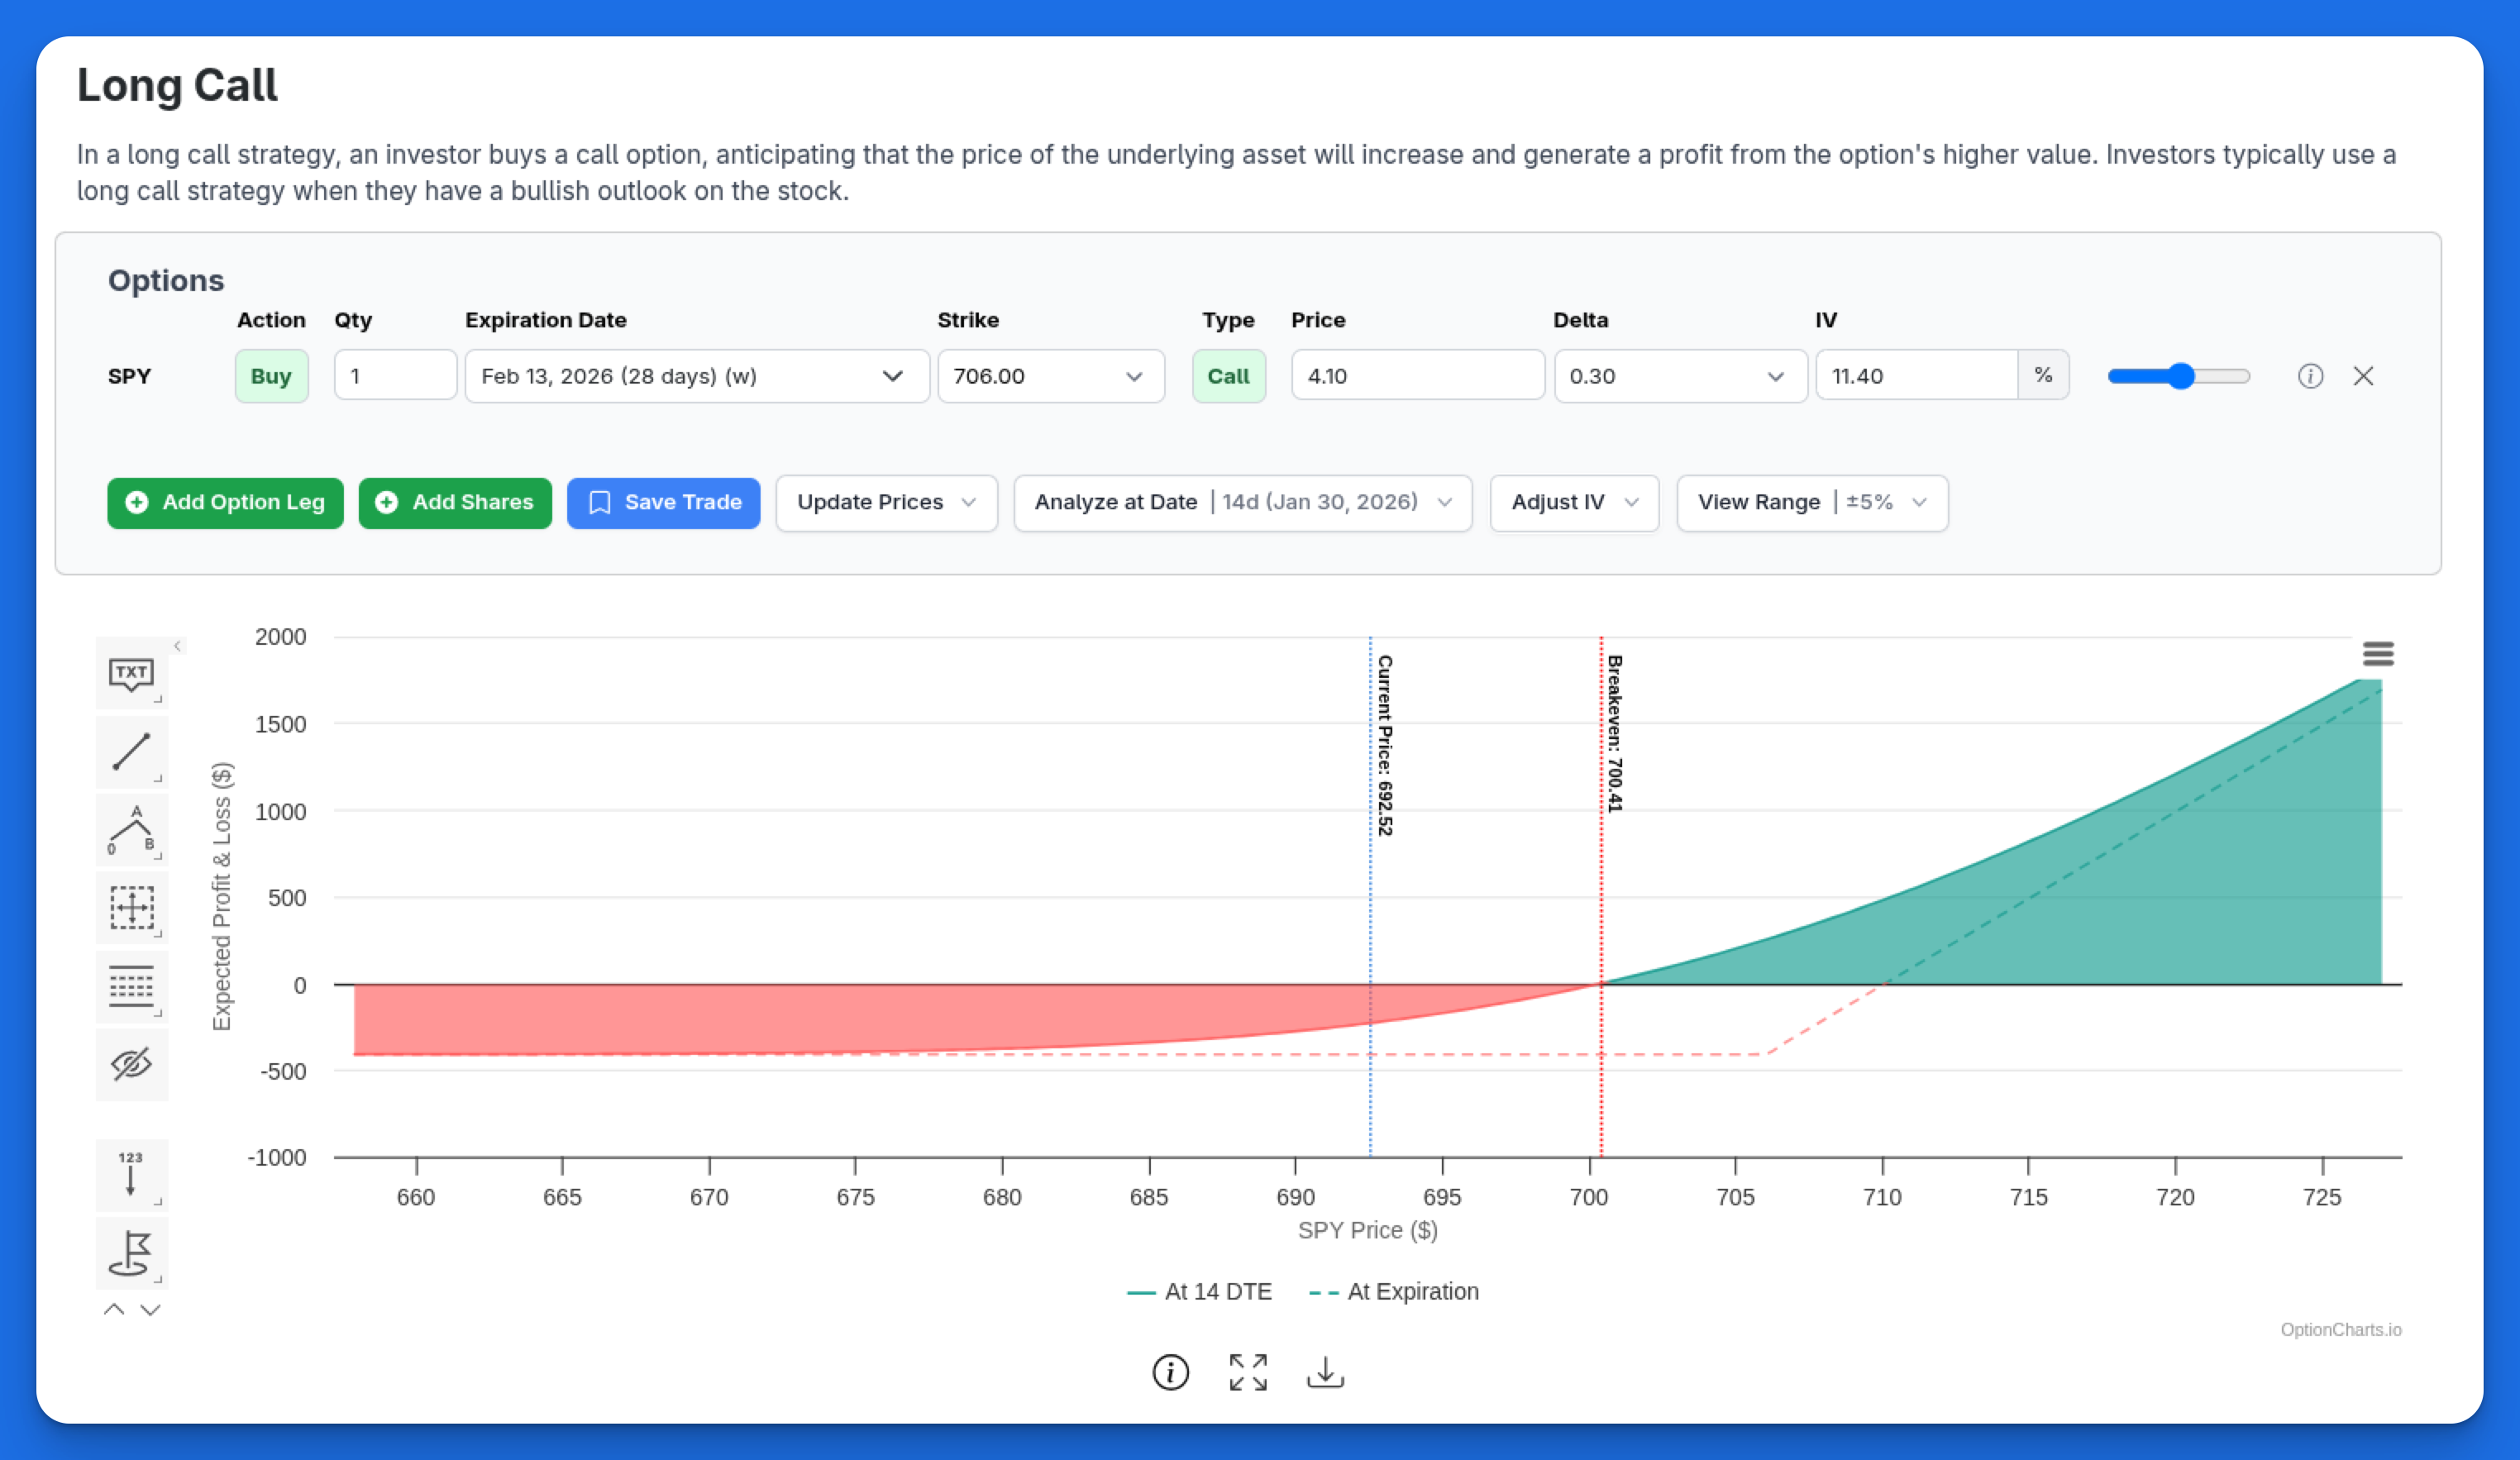
Long Call P&L Chart showing both pre-expiry (At 14 DTE) and at-expiration lines.
Horizontal Axis (X-axis)
The horizontal axis shows the underlying asset's price at expiration or the analyze date.
Vertical Axis (Y-axis)
The vertical axis shows the projected profit or loss at expiration or the chosen analysis date. Positive values on the y-axis represent a profit, while negative values represent a loss on the trade.
Underlying Price (blue-dotted line)
The current price of the stock. Also referred to as 'Spot Price'.
Breakeven Price (red-dotted line)
The breakeven price is the price at which the net gain on the trade is zero, meaning that no profit nor loss was incurred.
Pre-Expiry and At-Expiration Lines
When analyzing a position before expiration, the chart displays two P&L lines: the primary solid line shows projected P&L at your selected analysis date, while a secondary dashed line shows P&L at expiration. This dual-line view helps you compare the P&L at both points in time.
Chart Features
Adding an option leg
Click the "Add Option Leg" button to create a new option position.
You can modify this option by:
- Setting the strike price
- Adjusting the delta
- Changing the price
- Selecting type (call/put)
- Choosing action (buy/sell)
- Setting the quantity
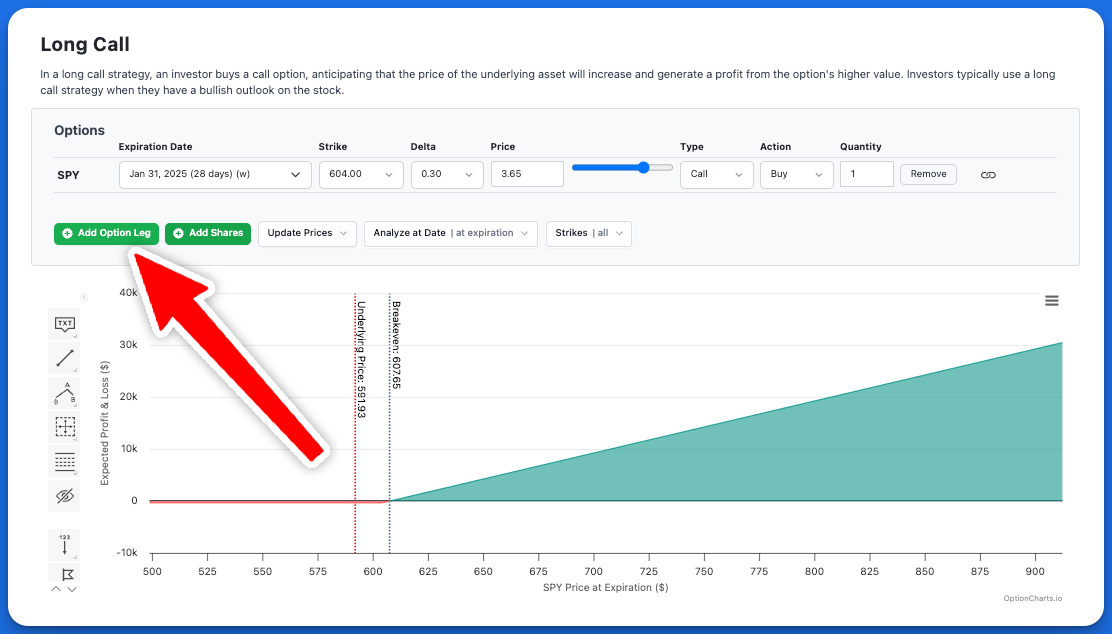
The Add Option Leg button on the Profit and Loss Chart.
Modifying option legs
You can use the range slider tool to quickly adjust the strike price and choose a different option.
You can also delete an option leg by clicking the 'remove' button located on the right side of the form.
Adding shares to the strategy
Click the "Add Shares" button to include stock positions in your option strategy. This is useful for covered calls, protective puts, and other stock-option combinations. You can customize your stock position by setting the quantity of shares or adjusting the share price. This helps you see how different stock positions affect your overall strategy performance.
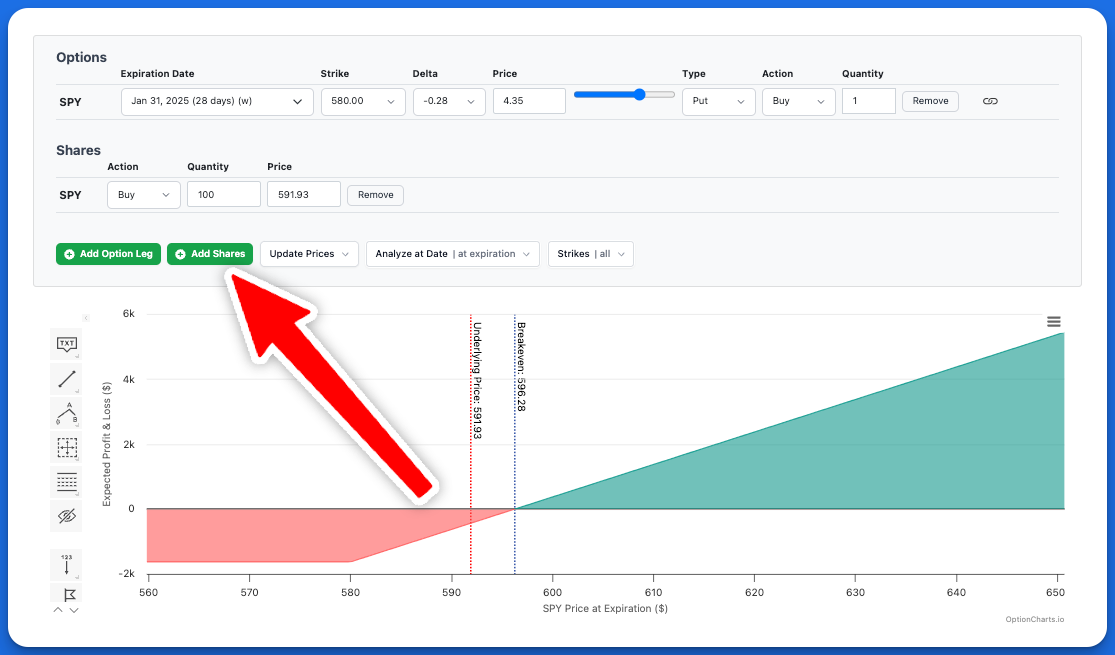
Adding shares to the Profit and Loss Chart.
Updating Trade Entry Prices
By default, the option's mid-price (average of the bid and ask price) is used as the entry cost for each option leg. You can update the option price on the chart to use bid, ask, or any custom value.
Updating the prices for each leg in a complex options strategy can be time-consuming, especially when dealing with multiple option legs. To streamline this process, OptionCharts offers an "Update Prices" feature that allows you to update the prices for multiple option legs at once. Use this feature to refresh the prices or choose a different pricing strategy.
How to Use the "Update Prices" Feature
-
Locate the "Update Prices" Button: In the Profit and Loss Chart toolbar, find and click the "Update Prices" button.
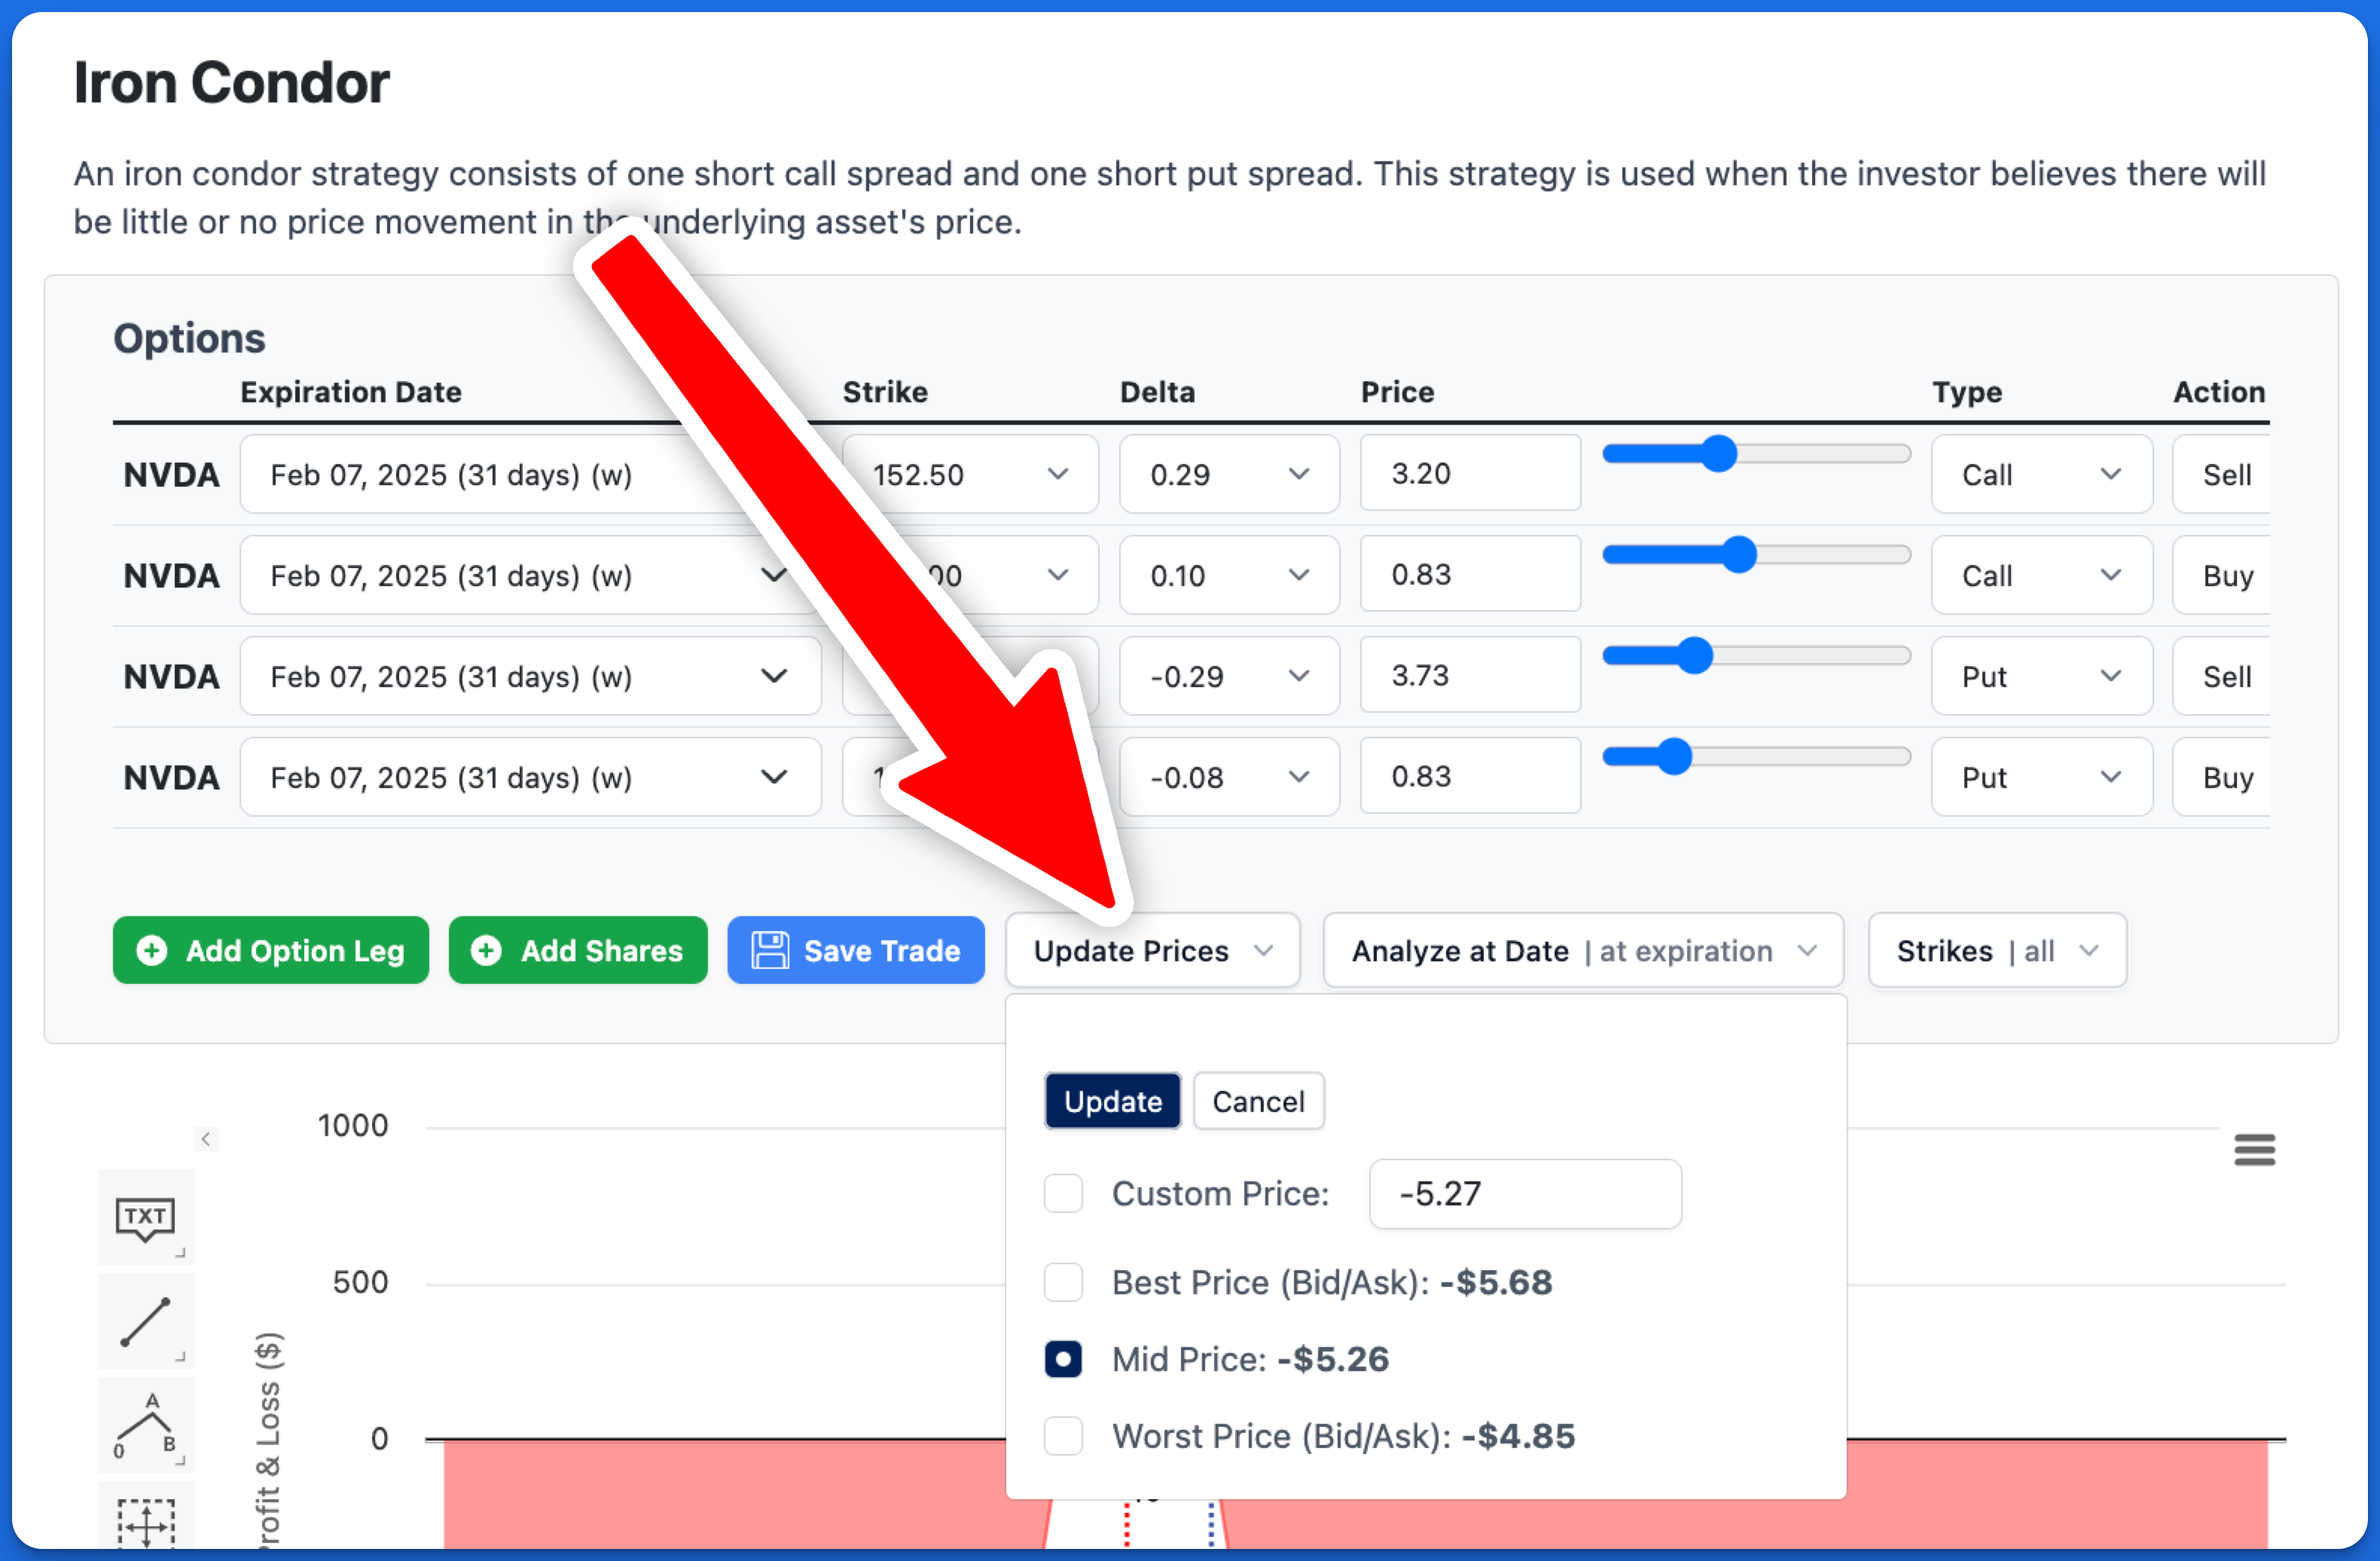
The "Update Prices" button in the toolbar
-
Choose a Pricing Option: Upon clicking, a dropdown menu appears with several pricing options.
- Custom Price: Manually input a specific price for your strategy. Input the net debit or credit of your entire strategy. Enter as a negative number for credit trades (when you receive money) and positive for debit trades (when you pay money). The value represents the price per share, so -5.27 means $527 for one contract.
- Best Price: Updates using the most favorable prices available which is bid price when buying an option and ask price when selling an option
- Mid Price: Uses the mid price of each option which is the average of the bid and ask price.
- Worst Price: Updates using the least favorable prices, which is the ask price when buying an option and the bid price when selling an option.
-
Apply the New Prices: After selecting your desired option, click "Update" to refresh the chart and trade details with the new pricing.
Analyze at Date
By default, the P&L chart analyzes the strategy assuming the trade is held until expiration. To model the trade at some date before expiration, adjust the DTE value in the Analyze at Date dropdown. DTE represents the number of days before expiration. Use this feature if you plan on closing your trade early and would like to see the estimated P&L at a date prior to expiration.
- Click the "Analyze at Date" dropdown
- Choose from preset DTE values or use the slider to quickly adjust
- Click "Update" to see the new chart
Fractional DTE values, such as 0.5 DTE, can be used to simulate closing a position halfway through the final trading day.
Note, for pre-expiration analysis we use the Black-Scholes formula to estimate option values.
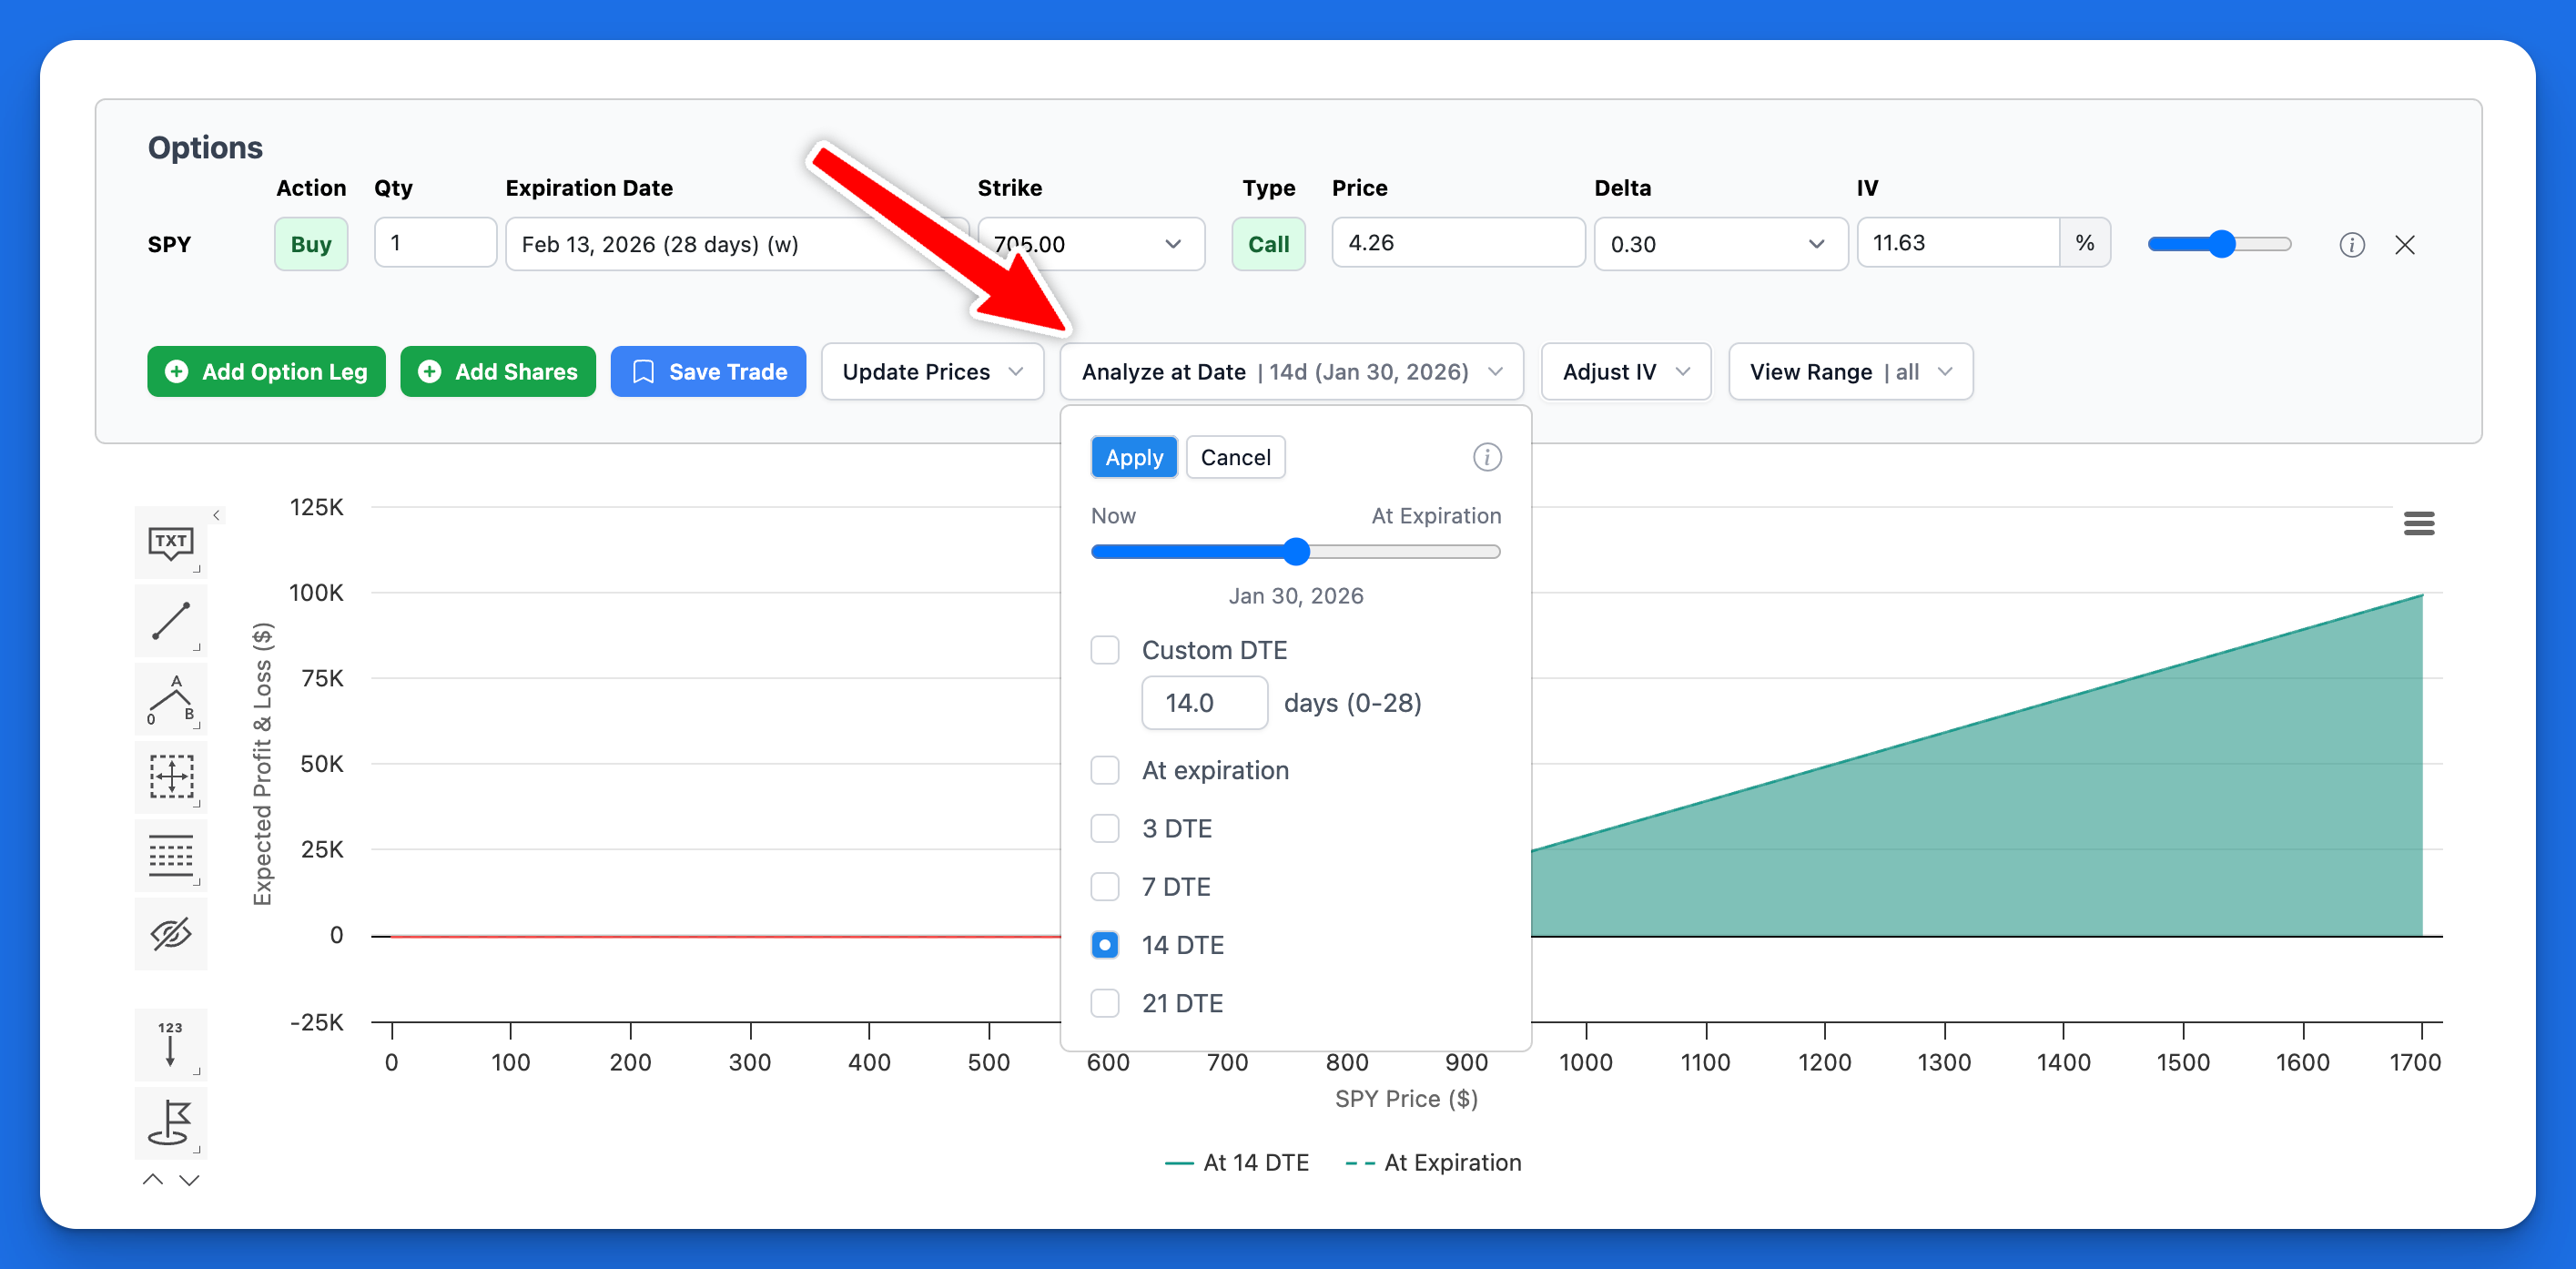
Analyze at Date dropdown with DTE options.
Adjust IV
Adjust the Implied Volatility (IV) of options to model how changes in IV affect your trade's profit and loss. IV adjustments affect P&L when analyzing a trade before expiration. At expiration, options have no time value (only intrinsic value), so IV is irrelevant. You can adjust IV for each leg individually, or multiple legs at once using the IV adjustment slider.
IV Adjustment Slider
Use the IV adjustment slider to increase or decrease IV across all option legs at once by a fixed amount. This is useful for quickly modeling IV expansion or IV contraction.
Per-Leg IV
Edit the IV field on each option leg individually for fine-tuned control. This allows you to model scenarios where volatility changes differently across options.
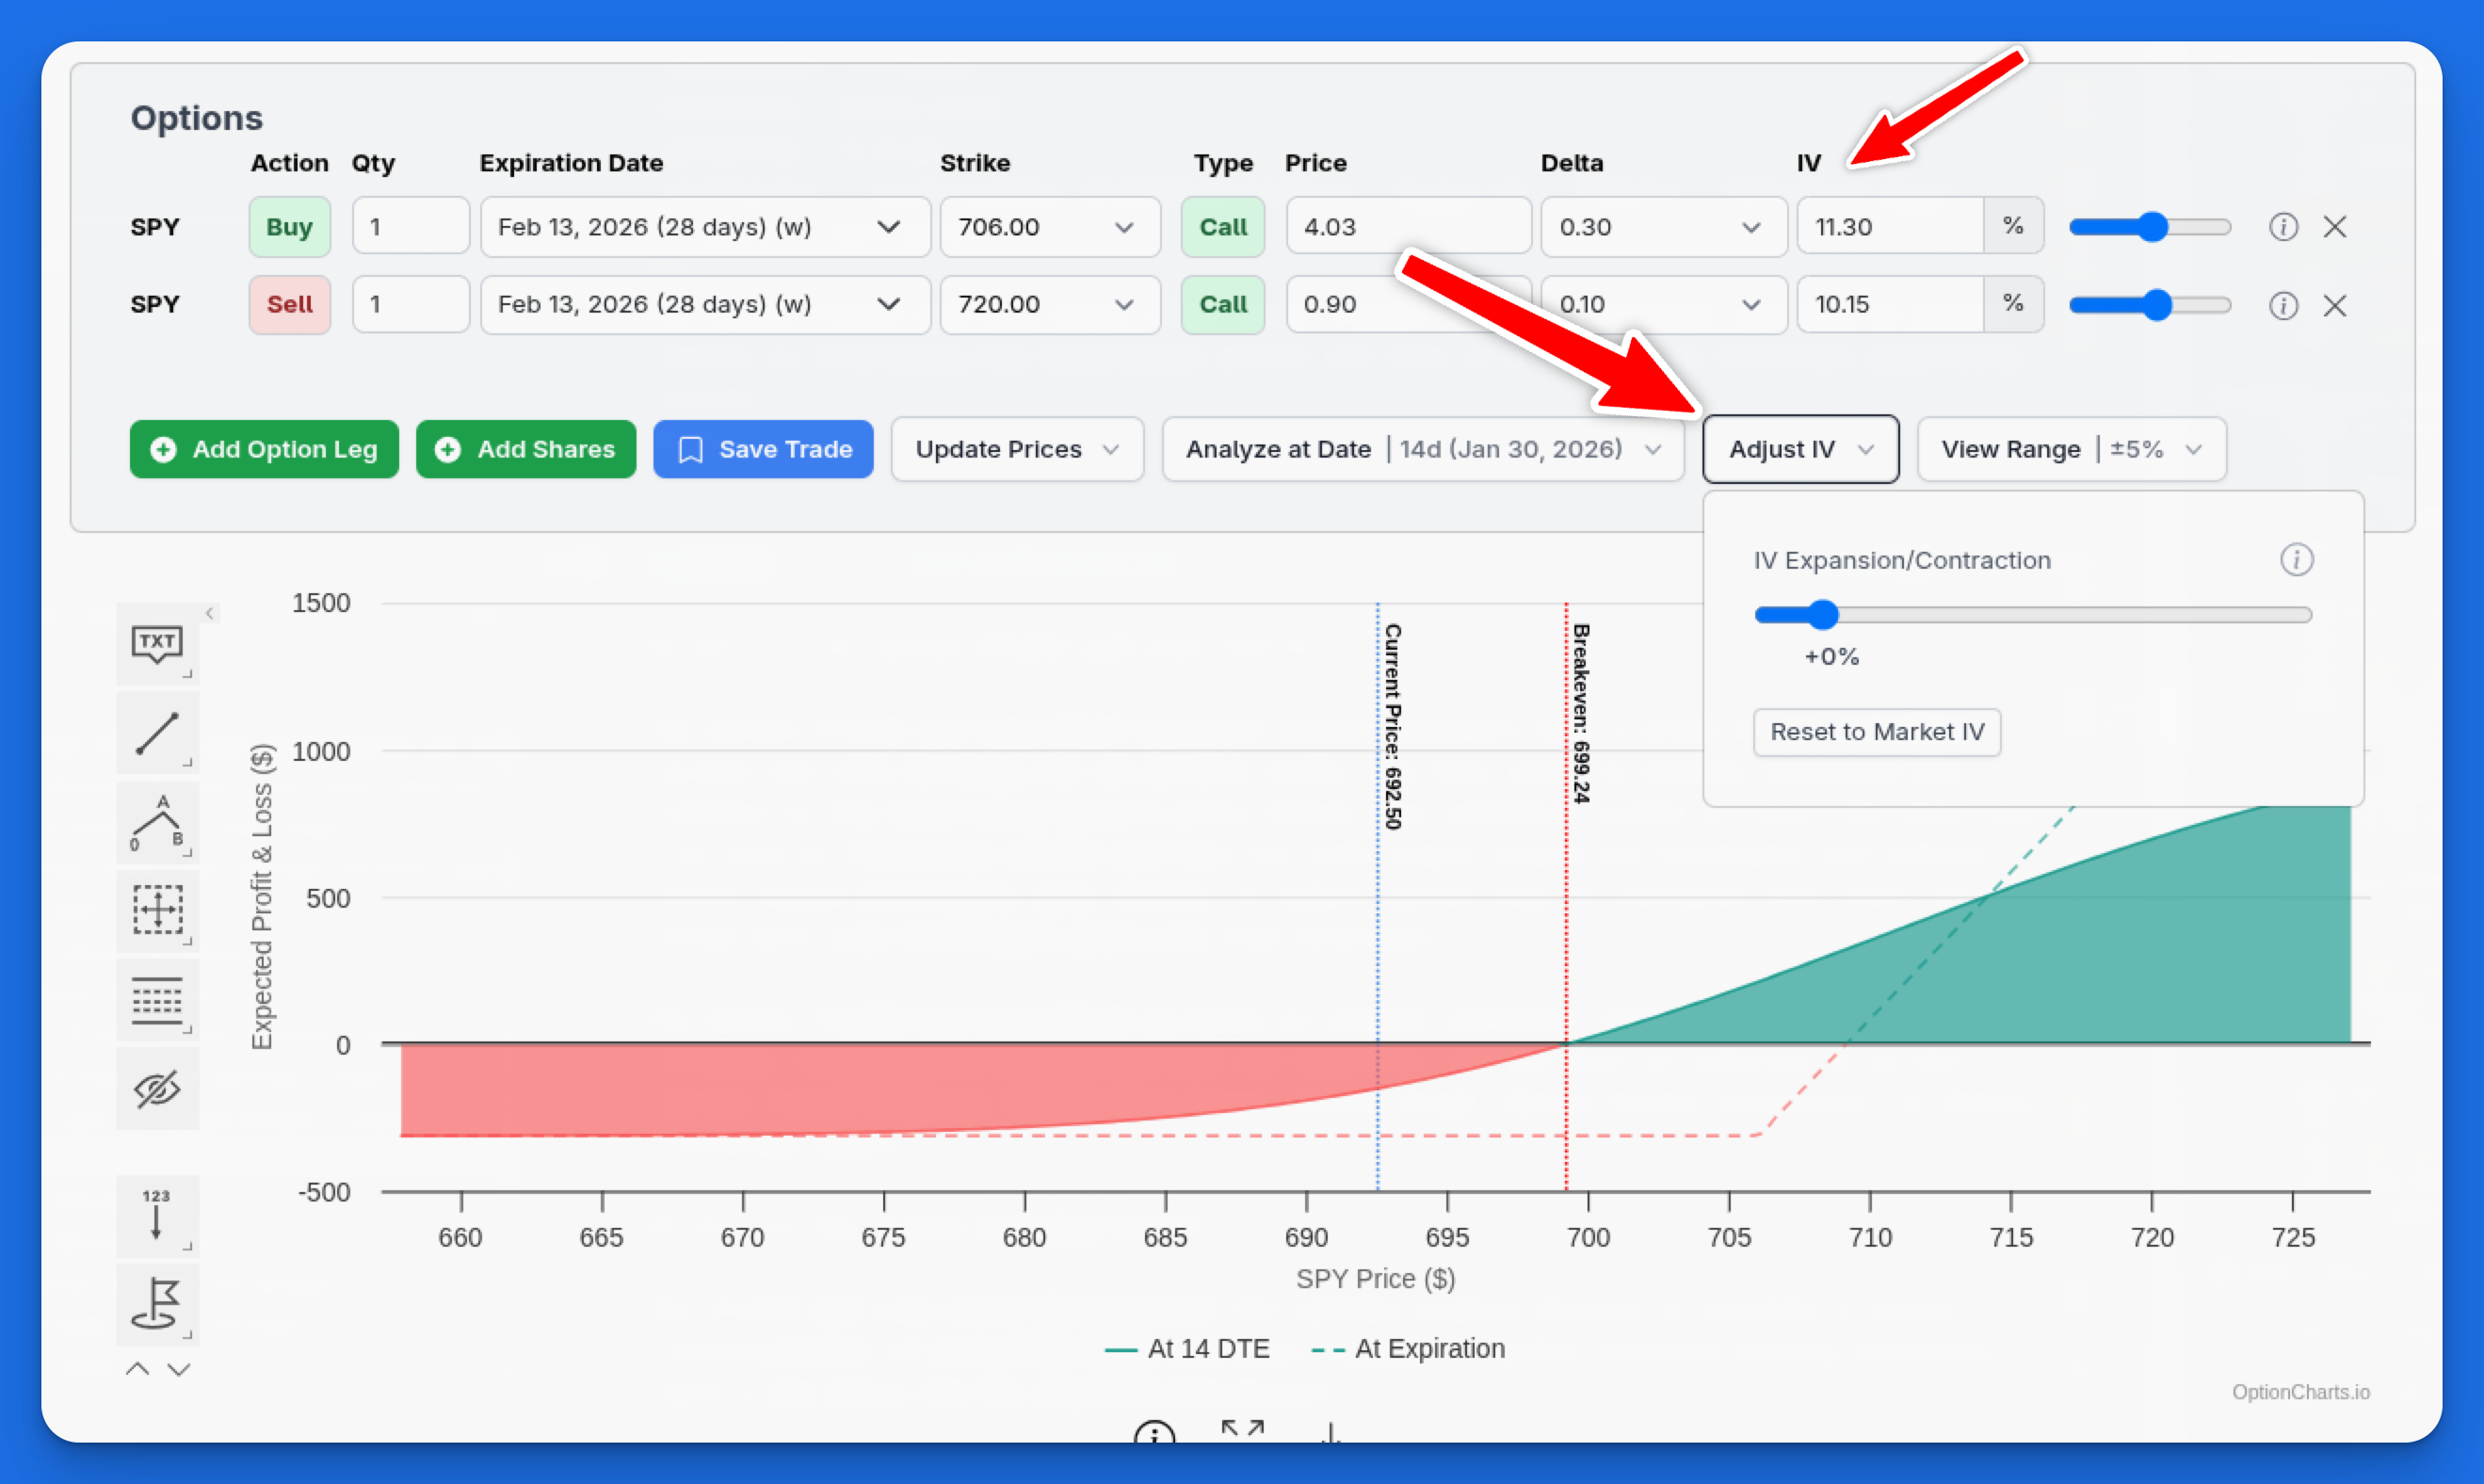
Adjust IV feature with IV adjustment slider and per-leg IV controls.
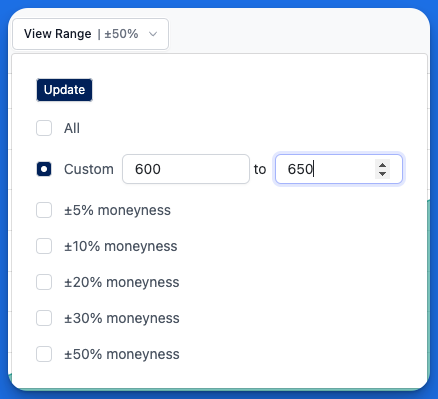
View Range
The View Range Selector allows you to zoom in or out on the chart by selecting x-axis values within a certain range. You can select a custom range of ending prices or choose from our preset "moneyness" ranges. Selecting a moneyness value (such as ±5%) will display ending prices that fall within that percentage above and below the current spot price. This filtering capability allows you to quickly zoom in and focus on relevant ranges.
Option Leg Details
Hover over the info icon on any option leg to view detailed contract information. This tooltip provides quick access to key metrics without leaving the chart.
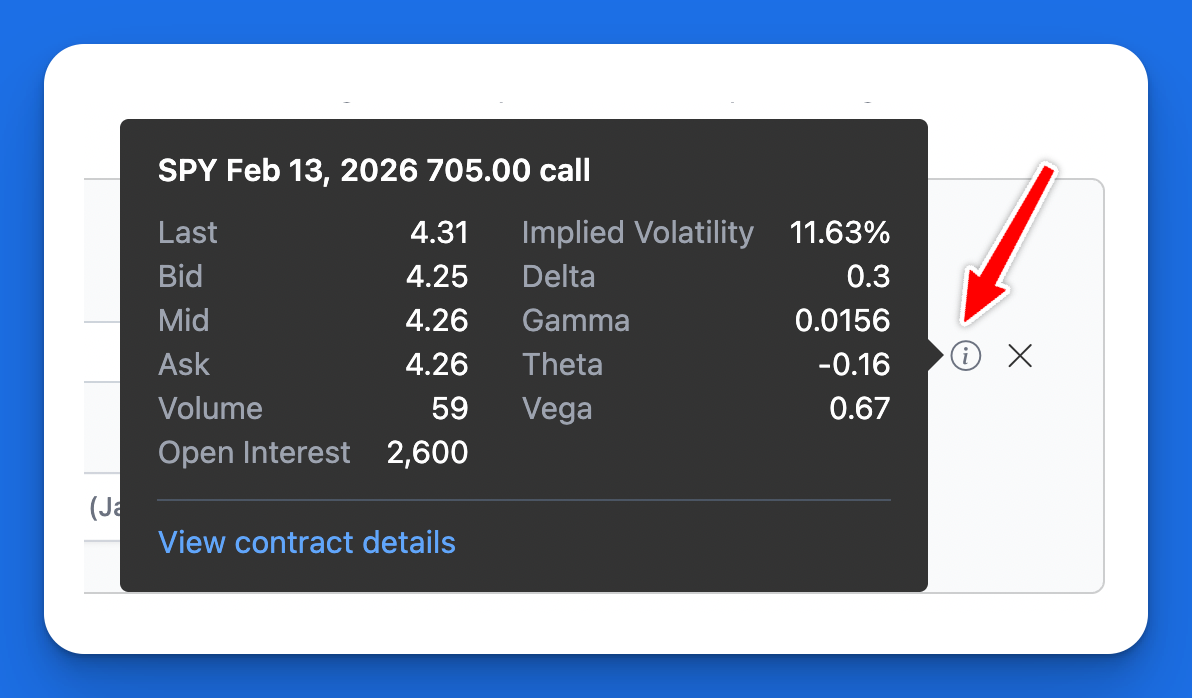
Option Leg Details tooltip with contract metrics.
Saving Your Trades
The Profit and Loss Chart includes a feature to save trade details, enabling you to maintain a history of your strategies and monitor and track their performance over time.
Learn more about saving trades here
Sharing Trades
You can share your P&L Chart with others to discuss strategies or refer to it later. Whenever you make a change to the P&L Chart, the url is updated automatically with the cost of entry, option legs, shares positions, and chart view settings. You can share this link with others or bookmark it for future reference.
FAQs
How do you calculate the profit or loss of an option trade?
The profit or loss calculation for options varies depending on whether you're analyzing the position at expiration or before expiration:
At Expiration:
The calculation at expiration is straightforward since all extrinsic (time) value has disappeared. The profit or loss is simply the difference between the option's expiration value and your entry cost. For example:
- If you buy a call option for $2.00 ($200 per contract) and the stock expires above your strike price, your profit would be: (Stock Price - Strike Price) - Initial Premium
Before Expiration:
When analyzing a position before expiration, the P&L chart uses the Black-Scholes model to estimate the option's theoretical value at your chosen analysis date.
- Your potential profit or loss is calculated as: Theoretical Future Option Value (calculated by Black-Scholes) - Entry Cost
How accurate is the Profit and Loss Chart?
The Profit and Loss Chart provides accurate theoretical values based on widely accepted option pricing models. However, real-world results may differ from these calculations due to several factors:
- Changes in implied volatility
- Early assignment risks
- Actual fill prices may differ from theoretical prices
- Ex-dividend dates aren’t included
- Transaction costs (commissions and fees) aren’t included
How is profit/loss calculated for calendar spreads and diagonal spreads?
In scenarios where the position includes multiple option legs with varying expiration dates, such as calendar spreads, the profit/loss calculation assumes options are held until the earliest expiration date among the legs. The estimated profit or loss is then calculated at the earliest expiration date, and the option values of the later expiring options are determined by using the Black-Scholes formula.
Can I analyze my trade at different points before expiration?
Yes, using the "Analyze at Date" feature, you can see how your strategy might perform before expiration. While the chart defaults to showing profit/loss at expiration, you can select specific dates or use preset intervals (like 7, 14, or 21 days before expiry) to analyze earlier points in time. When analyzing before expiration, the Black-Scholes model calculates theoretical option values including both intrinsic and time value. This helps you understand potential outcomes if you plan to close your position before the options expire.
Why do the profit/loss calculations change when analyzing before expiration?
When analyzing before expiration, options still retain time value, which affects their price and your potential profit or loss. The Black-Scholes model calculates this theoretical value based on factors like remaining time, volatility, and the underlying price. This means your profit/loss at earlier dates may differ significantly from what you'd see at expiration, especially for out-of-the-money options that still have time value. Understanding these differences is crucial for planning exit strategies and managing your positions effectively.
How do I analyze an existing position in my portfolio?
To analyze an existing position, simply add the option legs and/or shares that match your current holdings. You can adjust the entry prices to match your actual fill prices using the price input field or the "Update Prices" feature. This allows you to evaluate your current position and explore potential adjustments.
Why might my strategy's profit/loss look different from other platforms?
While the fundamental calculations are consistent across platforms, differences can occur due to varying assumptions about implied volatility, interest rates, and dividends. Additionally, some platforms might include transaction costs or use different pricing models for pre-expiration analysis.
Can I save my custom strategies for future use?
Yes, you can save any strategy setup using the "Save Trade" button. This creates a record of your trade that you can reference later or share with others. Saved trades also allow you to track actual performance against your initial analysis.
Additional Resources
- "All Strategies". The Options Industry Council. https://www.optionseducation.org/strategies/all-strategies-en
- "Risk Graph". Investopedia. https://www.investopedia.com/terms/r/riskgraph.asp