Chart Features
OptionCharts offers interactive features that allow you to filter options data, manipulate charts, and customize your view.
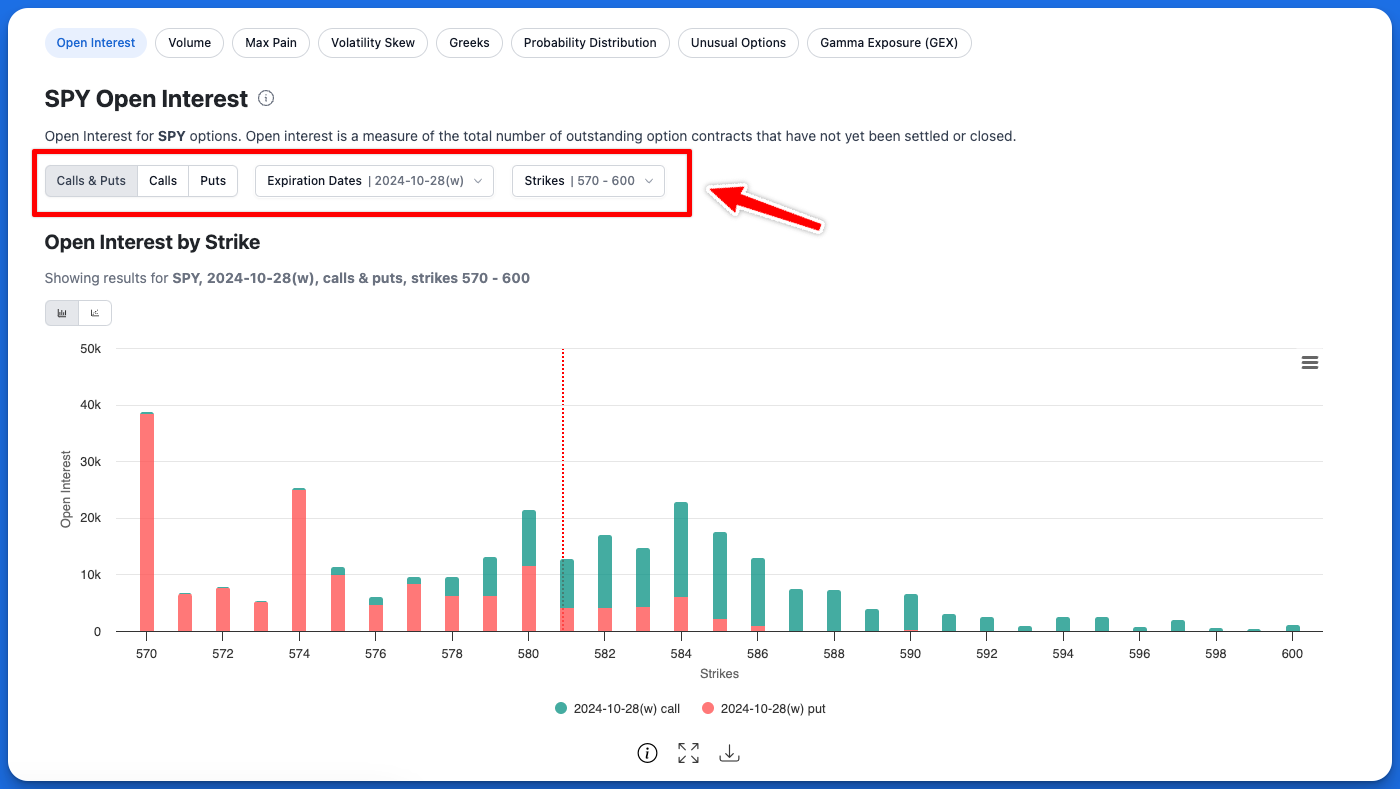
Option Filters
Filter by Calls and Puts
You can choose to view data for only call options, only put options, or both.
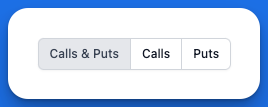
calls and puts selector
Filter by Expiration
You can filter chart data by expiration date to focus on specific expiries. You can view option data for a single expiration date or multiple expiration dates.
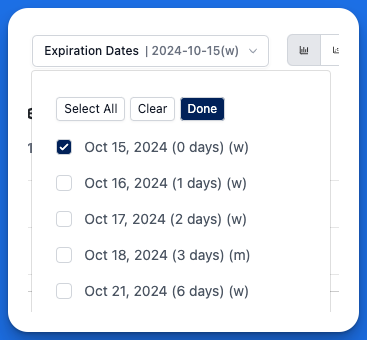
expiration dates selector
Filter by Strikes
This filter enables you to view options data within a specific range of strike prices. You can filter using either a custom range (for example, strikes between 550-600) or by selecting a moneyness percentage value. When using moneyness filtering, selecting a value (such as ±5%) will display options with strikes that fall within that percentage above and below the current spot price. This filtering capability allows you to quickly zoom in and focus on relevant strike price ranges.
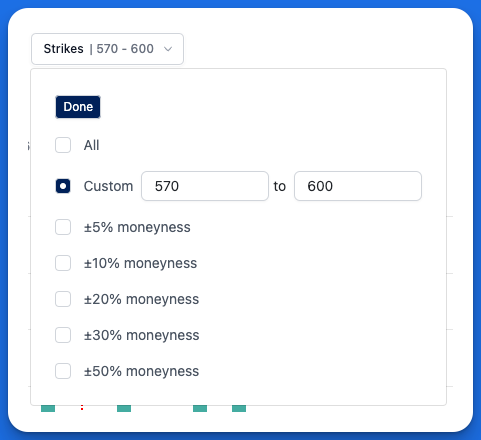
strike range selector
Zooming In on Charts
You can zoom in on specific sections of the chart for a more granular view of the data. To zoom in simply click and drag your mouse over the chart. For touch devices you can pinch to zoom in and out. Click the "reset zoom" button in the upper right of the chart to zoom back out again.
View information about each chart
You can view information about a chart by clicking the info button below each chart.
View Charts in Full Screen (Premium Feature)
Premium users can view charts in full-screen providing a more detailed view of the data. To view charts in full-screen click the full-screen button located below each chart.
Download Chart Data as a CSV (Premium Feature)
Premium users can download the chart data in CSV format for further analysis. To download chart data click the download button located below each chart.
Chart Tools (Premium Feature)
The Chart Tools menu appears on the left side of each chart and allows you to add annotations, indicators, and perform interactions with charts.
For price history charts, this menu allows you to add technical indicators such as simple moving averages (SMA), exponential moving averages (EMA), Bollinger bands (BB), and more.
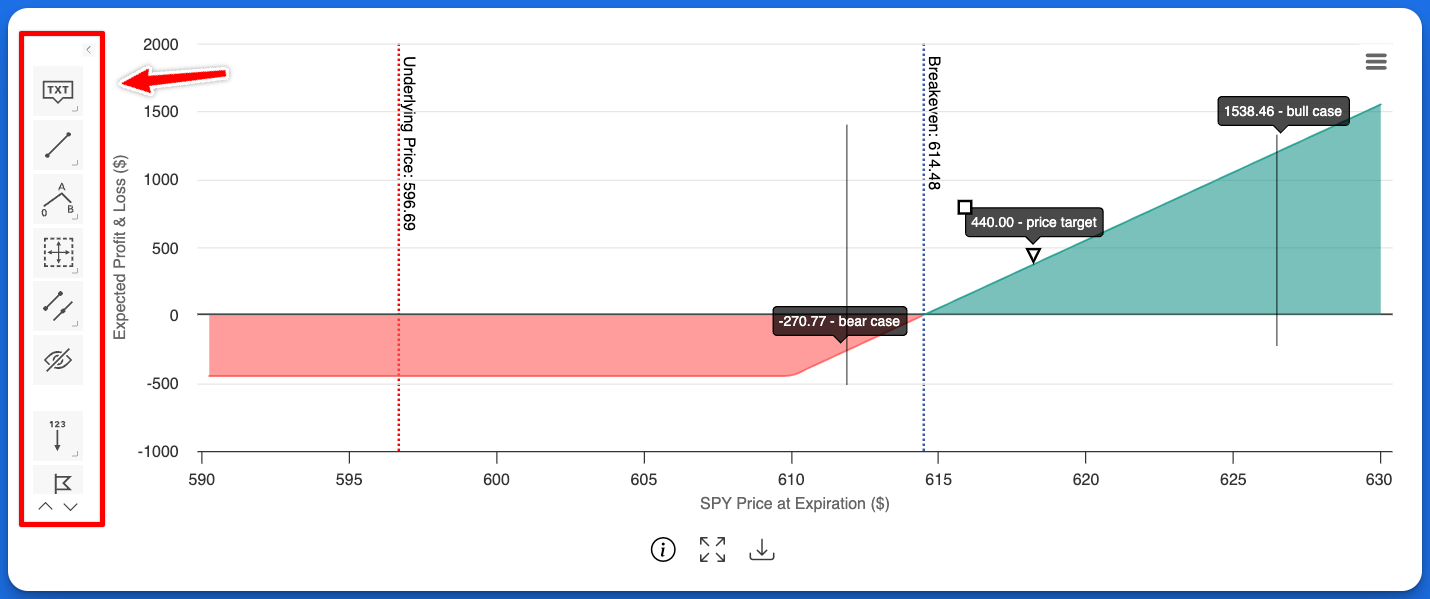
Use the Chart Tools menu for adding text annotations and indicators to charts
Enable or Disable Chart Tools
By default, Chart Tools is enabled for premium accounts. You can enable or disable Chart Tools in your account settings.
To enable or disable Chart Tools, go to: Account Settings > Chart Settings > Enable Chart Tools
Chart Themes (Premium Feature)
Chart themes allow you to customize the style and appearance of charts to suit your preferences. You can choose from a variety of themes, including light and dark.
To change the chart theme, go to: Account Settings > Chart Settings > Chart Theme
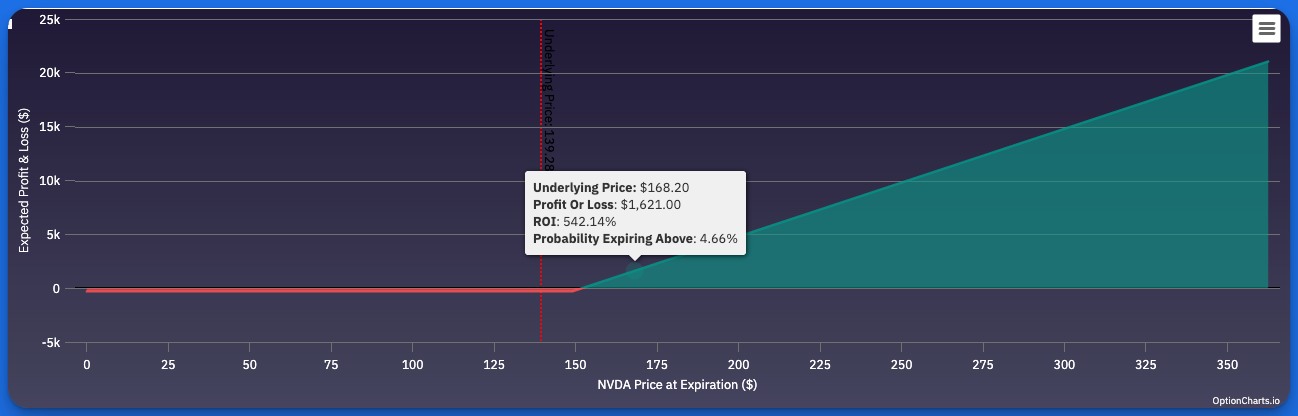
Select from a variety of chart themes
Click a Point to Navigate to an Option
For select charts, clicking on a specific data point on the chart will direct you to a detailed view of the corresponding option contract, allowing you to quickly access relevant information about the option.