Understanding Max Pain in Options Trading
Max pain represents the price point at which option sellers will experience the least amount of total maximum loss, while option buyers will experience the maximum loss or "max pain". The theory is based on the idea that the market will trend towards the price where the largest number of options contracts will expire worthless and option buyers experience the maximum loss.
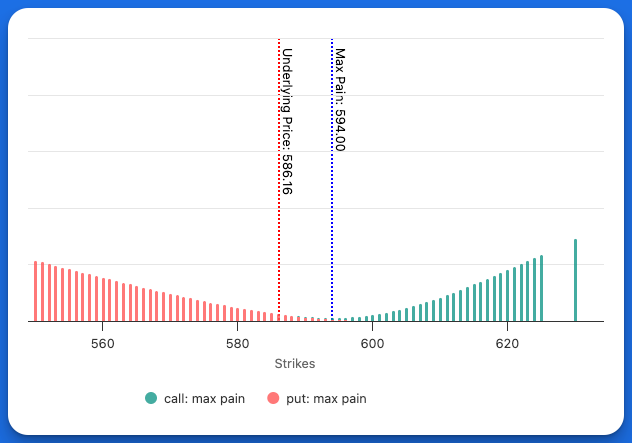
Illustration of Max Pain on OptionCharts.io
What is Max Pain?
Max Pain is a concept in options trading, offering valuable insights into potential market movements and trader behavior. Max Pain refers to the price level where the greatest number of option contracts would expire worthless, resulting in maximum losses for option buyers.
How to Use Max Pain in Options Trading
- Max Pain helps identify the price level where the most options contracts (calls and puts) expire worthless, potentially influencing price movement.
- Monitoring the Max Pain level can provide insights into potential market manipulation or tendencies near expiration dates.
- If the price gravitates toward the Max Pain level as expiration approaches, it could indicate the impact of market makers seeking to minimize payout obligations.
- Max Pain can act as a reference point for traders to expect price behavior around expiration.
- When combined with price, volume, and open interest, Max Pain offers a more comprehensive view of market sentiment and potential trends.
Let's look at an example using real HOOD (Robinhood) options data:
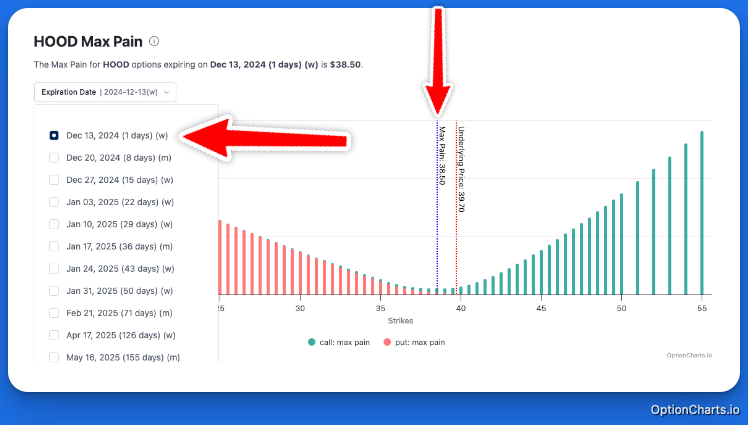
HOOD options data showing Max Pain
Key Observations:
- We're observing the Dec 13, 2024 expiry that expires in 1 day.
- Max Pain is 38.50, which is about a dollar below the current price of $39.70.
This max pain suggests that market makers, or option sellers, have an incentive to influence the stock price lower, aiming to have the contracts they sold expire worthless.
This can give us a clue on where HOOD might head towards tomorrow, or even for the rest of the day today. When combining max pain with Option Volume and Open Interest trades can make better informed trading decisions.
How to Interpret the Max Pain Chart
Let's break down the Max Pain Chart that we provide on OptionCharts.
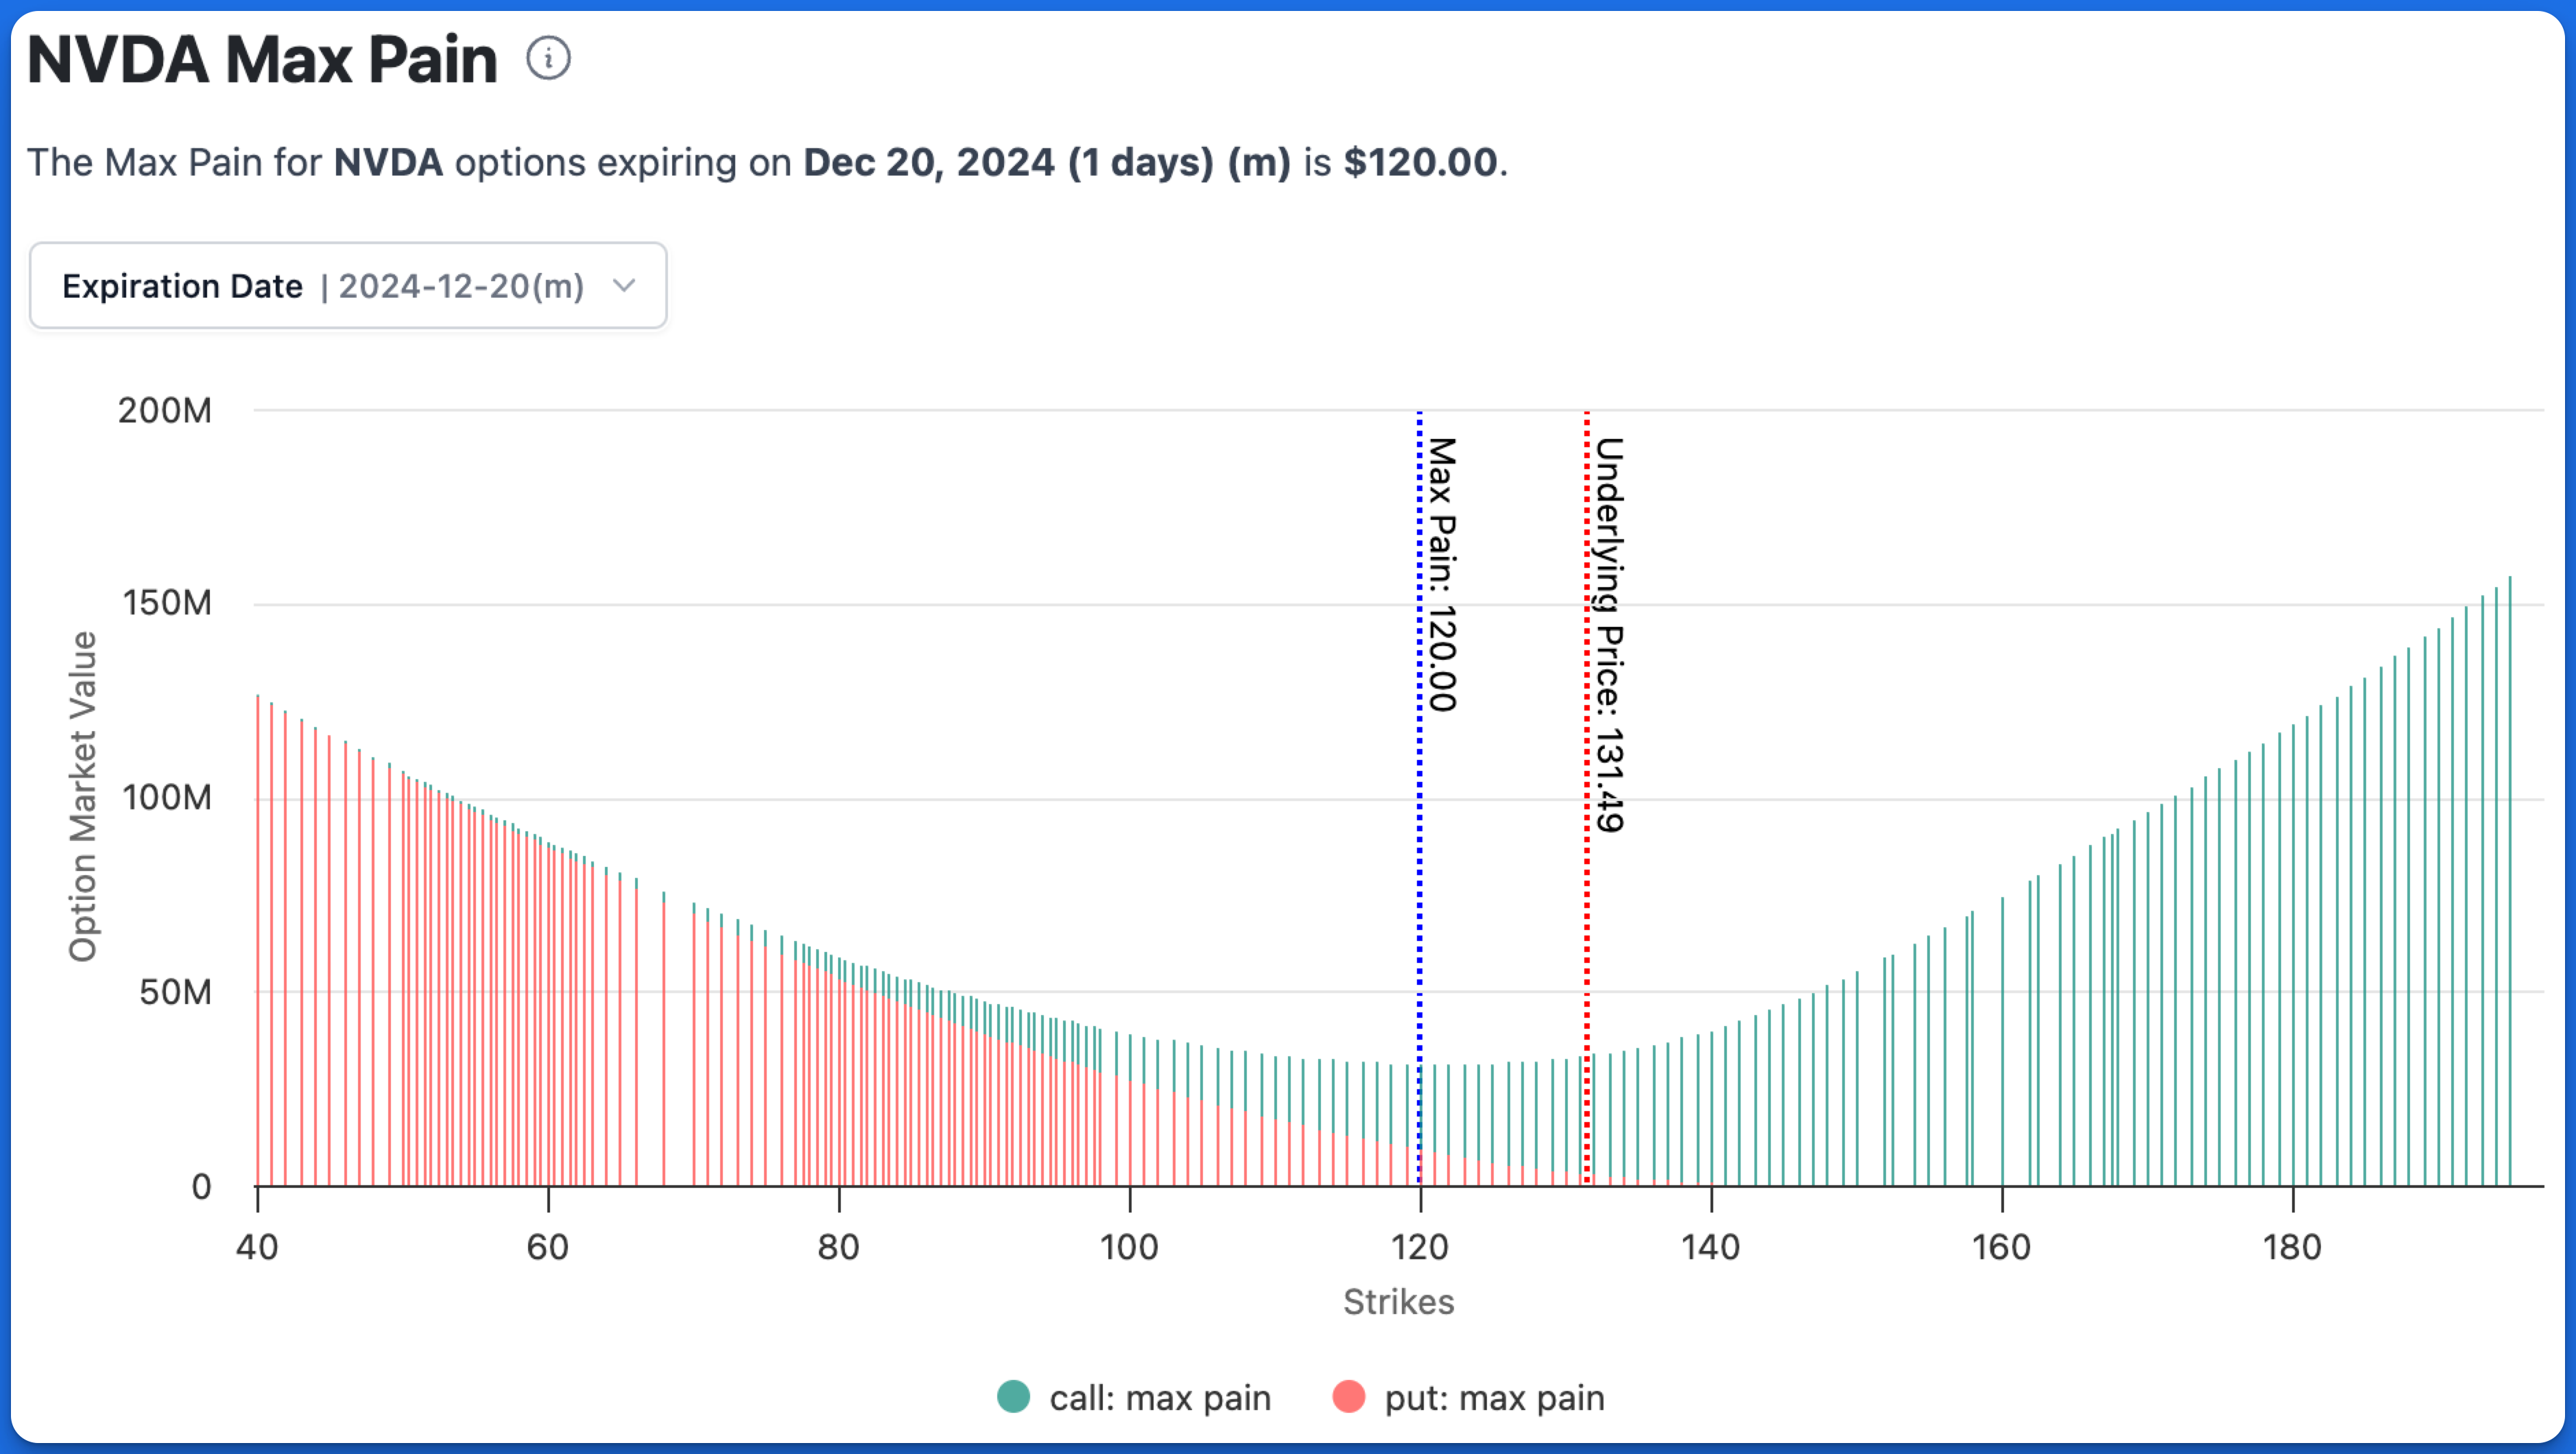
NVDA Max Pain Chart
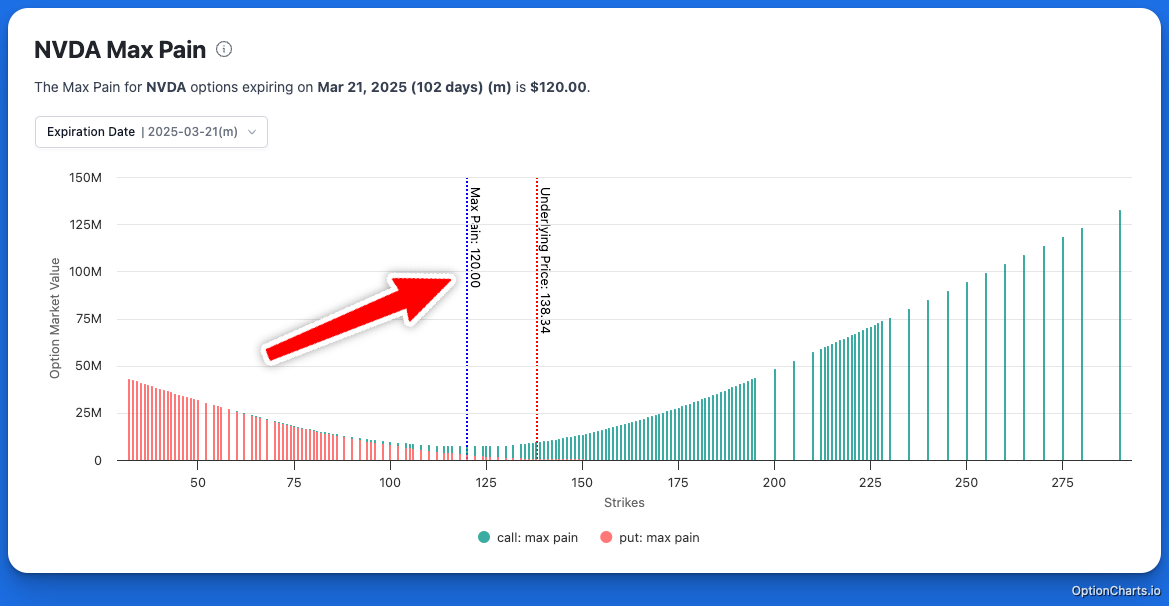
In this example for NVDA's Max Pain, the X-axis measures the strike prices that are available.
The Y-axis shows the total monetary value of the option contracts at expiration.
Together, these axes illustrate the distribution of financial liability for option sellers. The point where the green and red bars are lowest indicates the strike price where option sellers, or market makers, owe the least to option buyers.
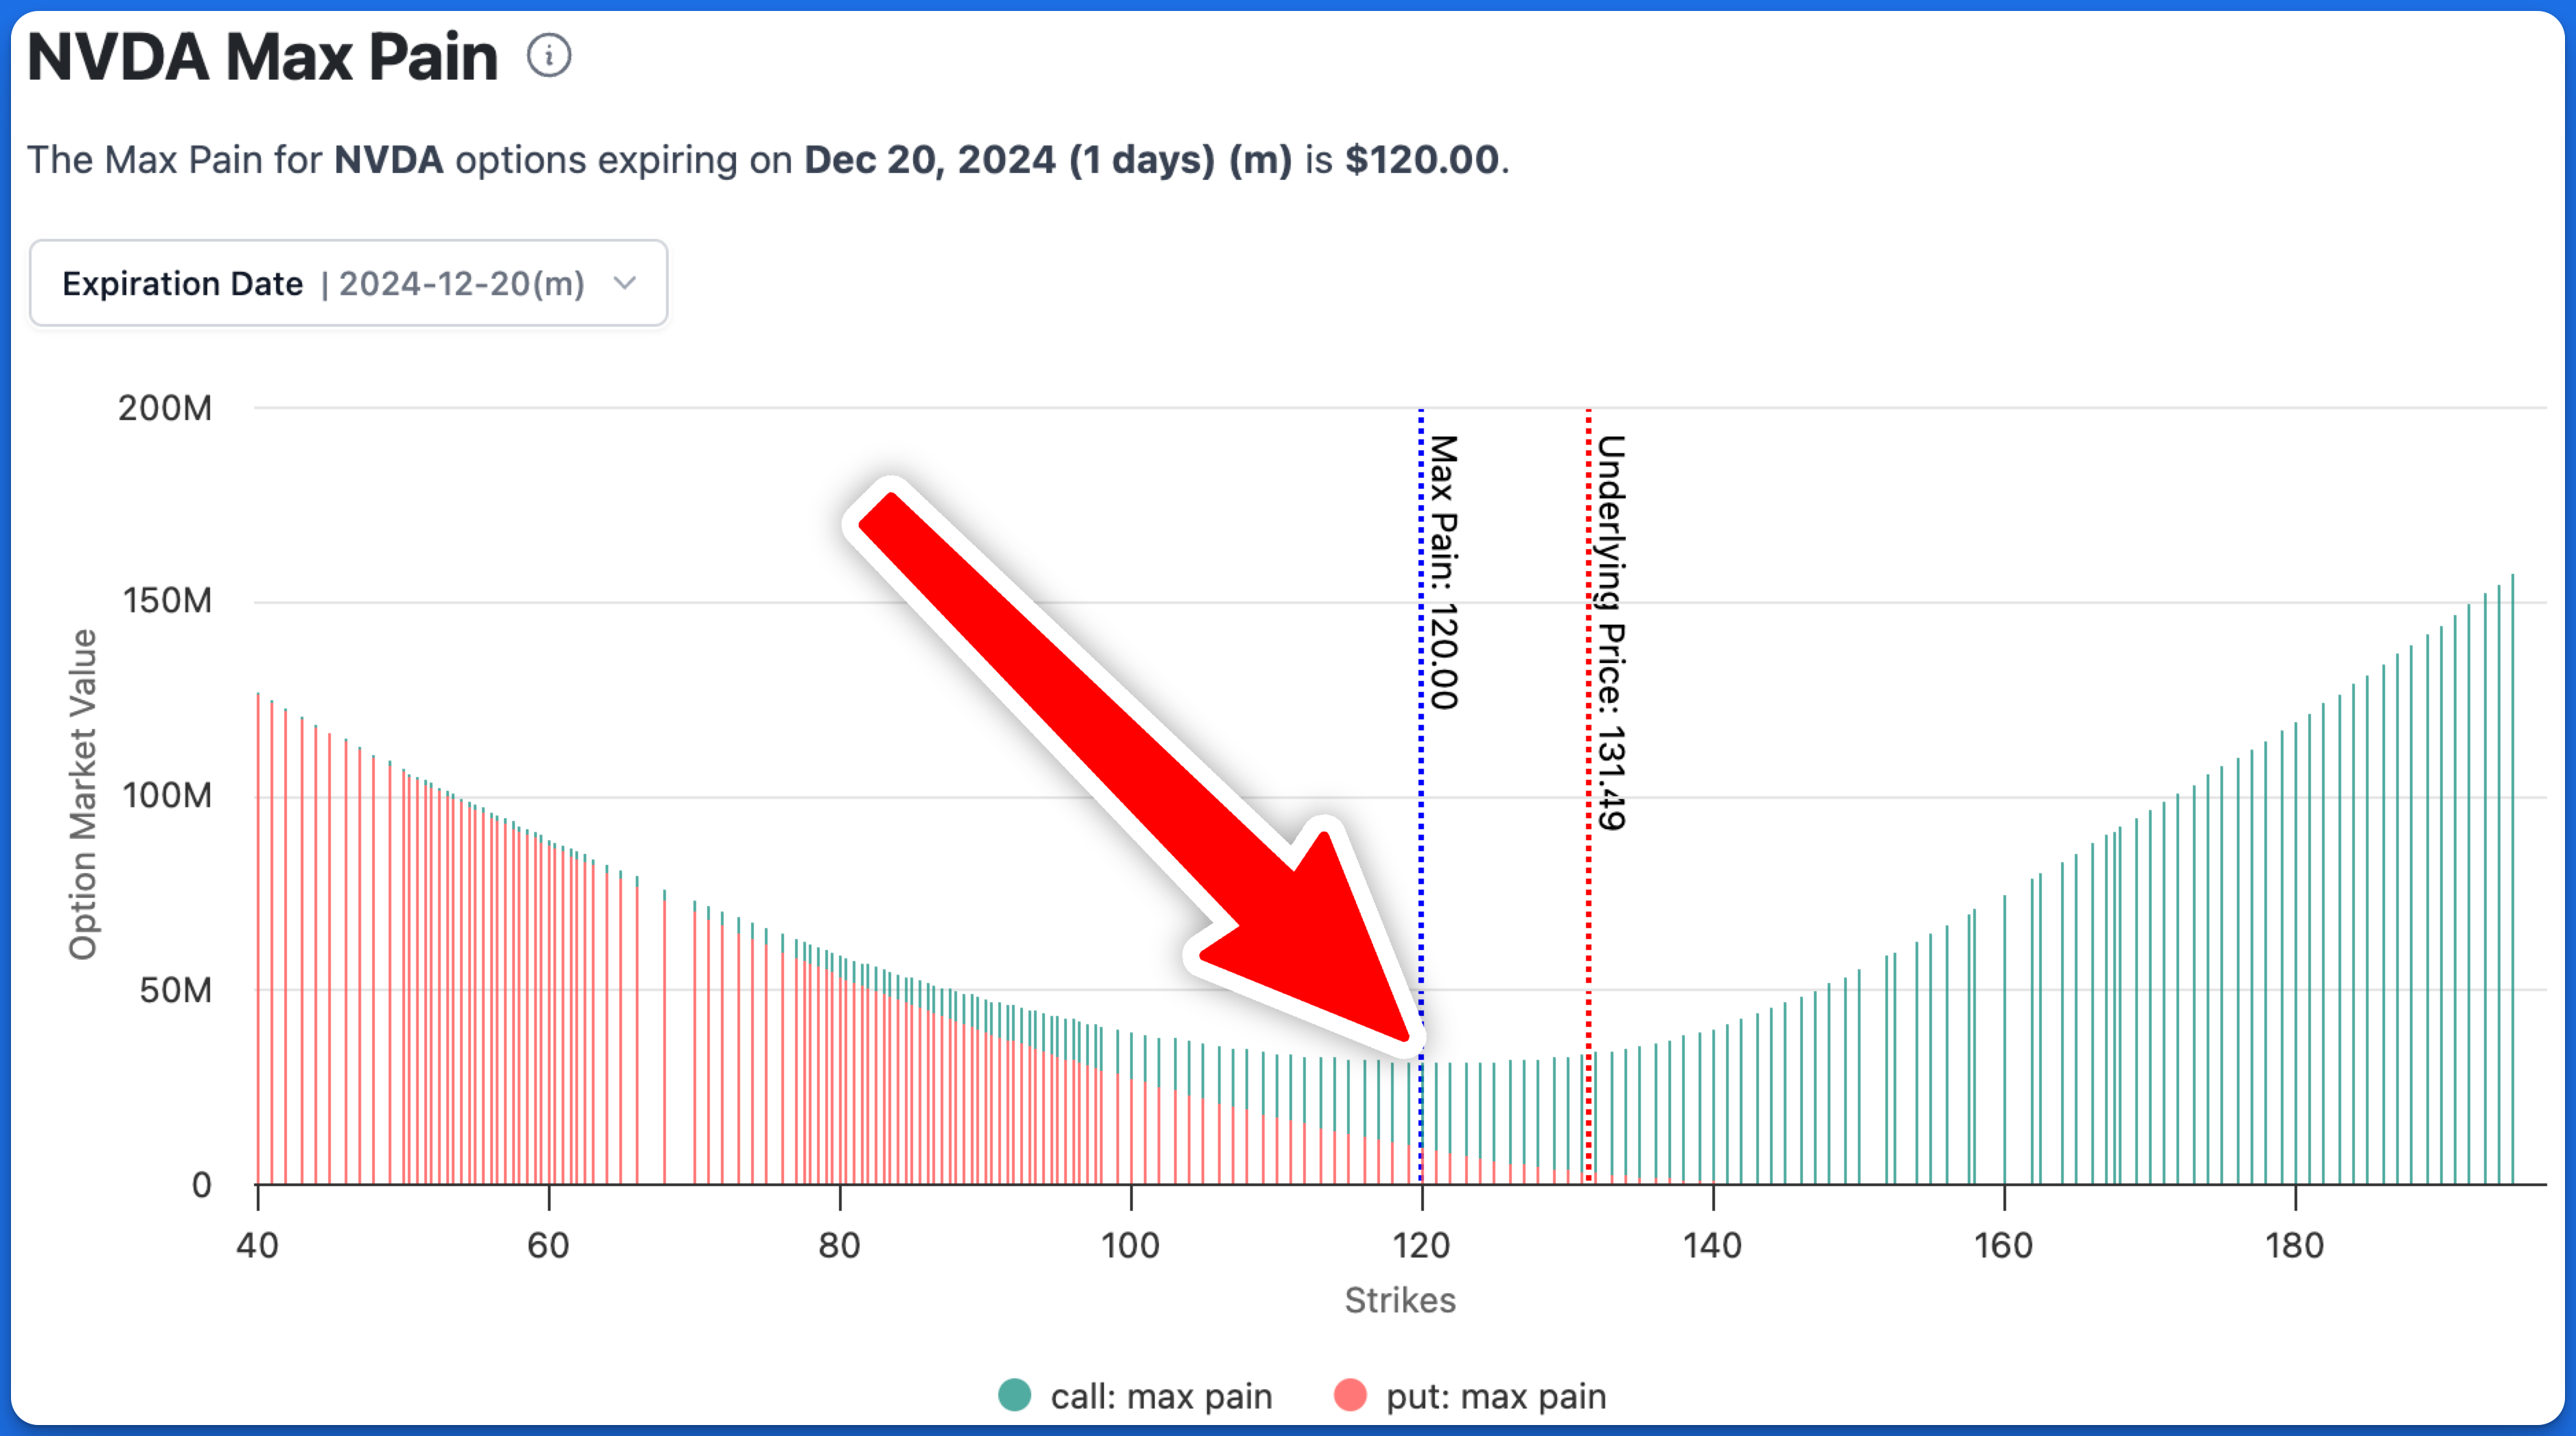
NVDA Max Pain Chart indicating Max Pain value.
Max theory implies that as expiration nears, the underlying price (current stock price) will gravitate towards the Max Pain price, minimizing losses for hedge funds and inducing maximum pain for retail traders.
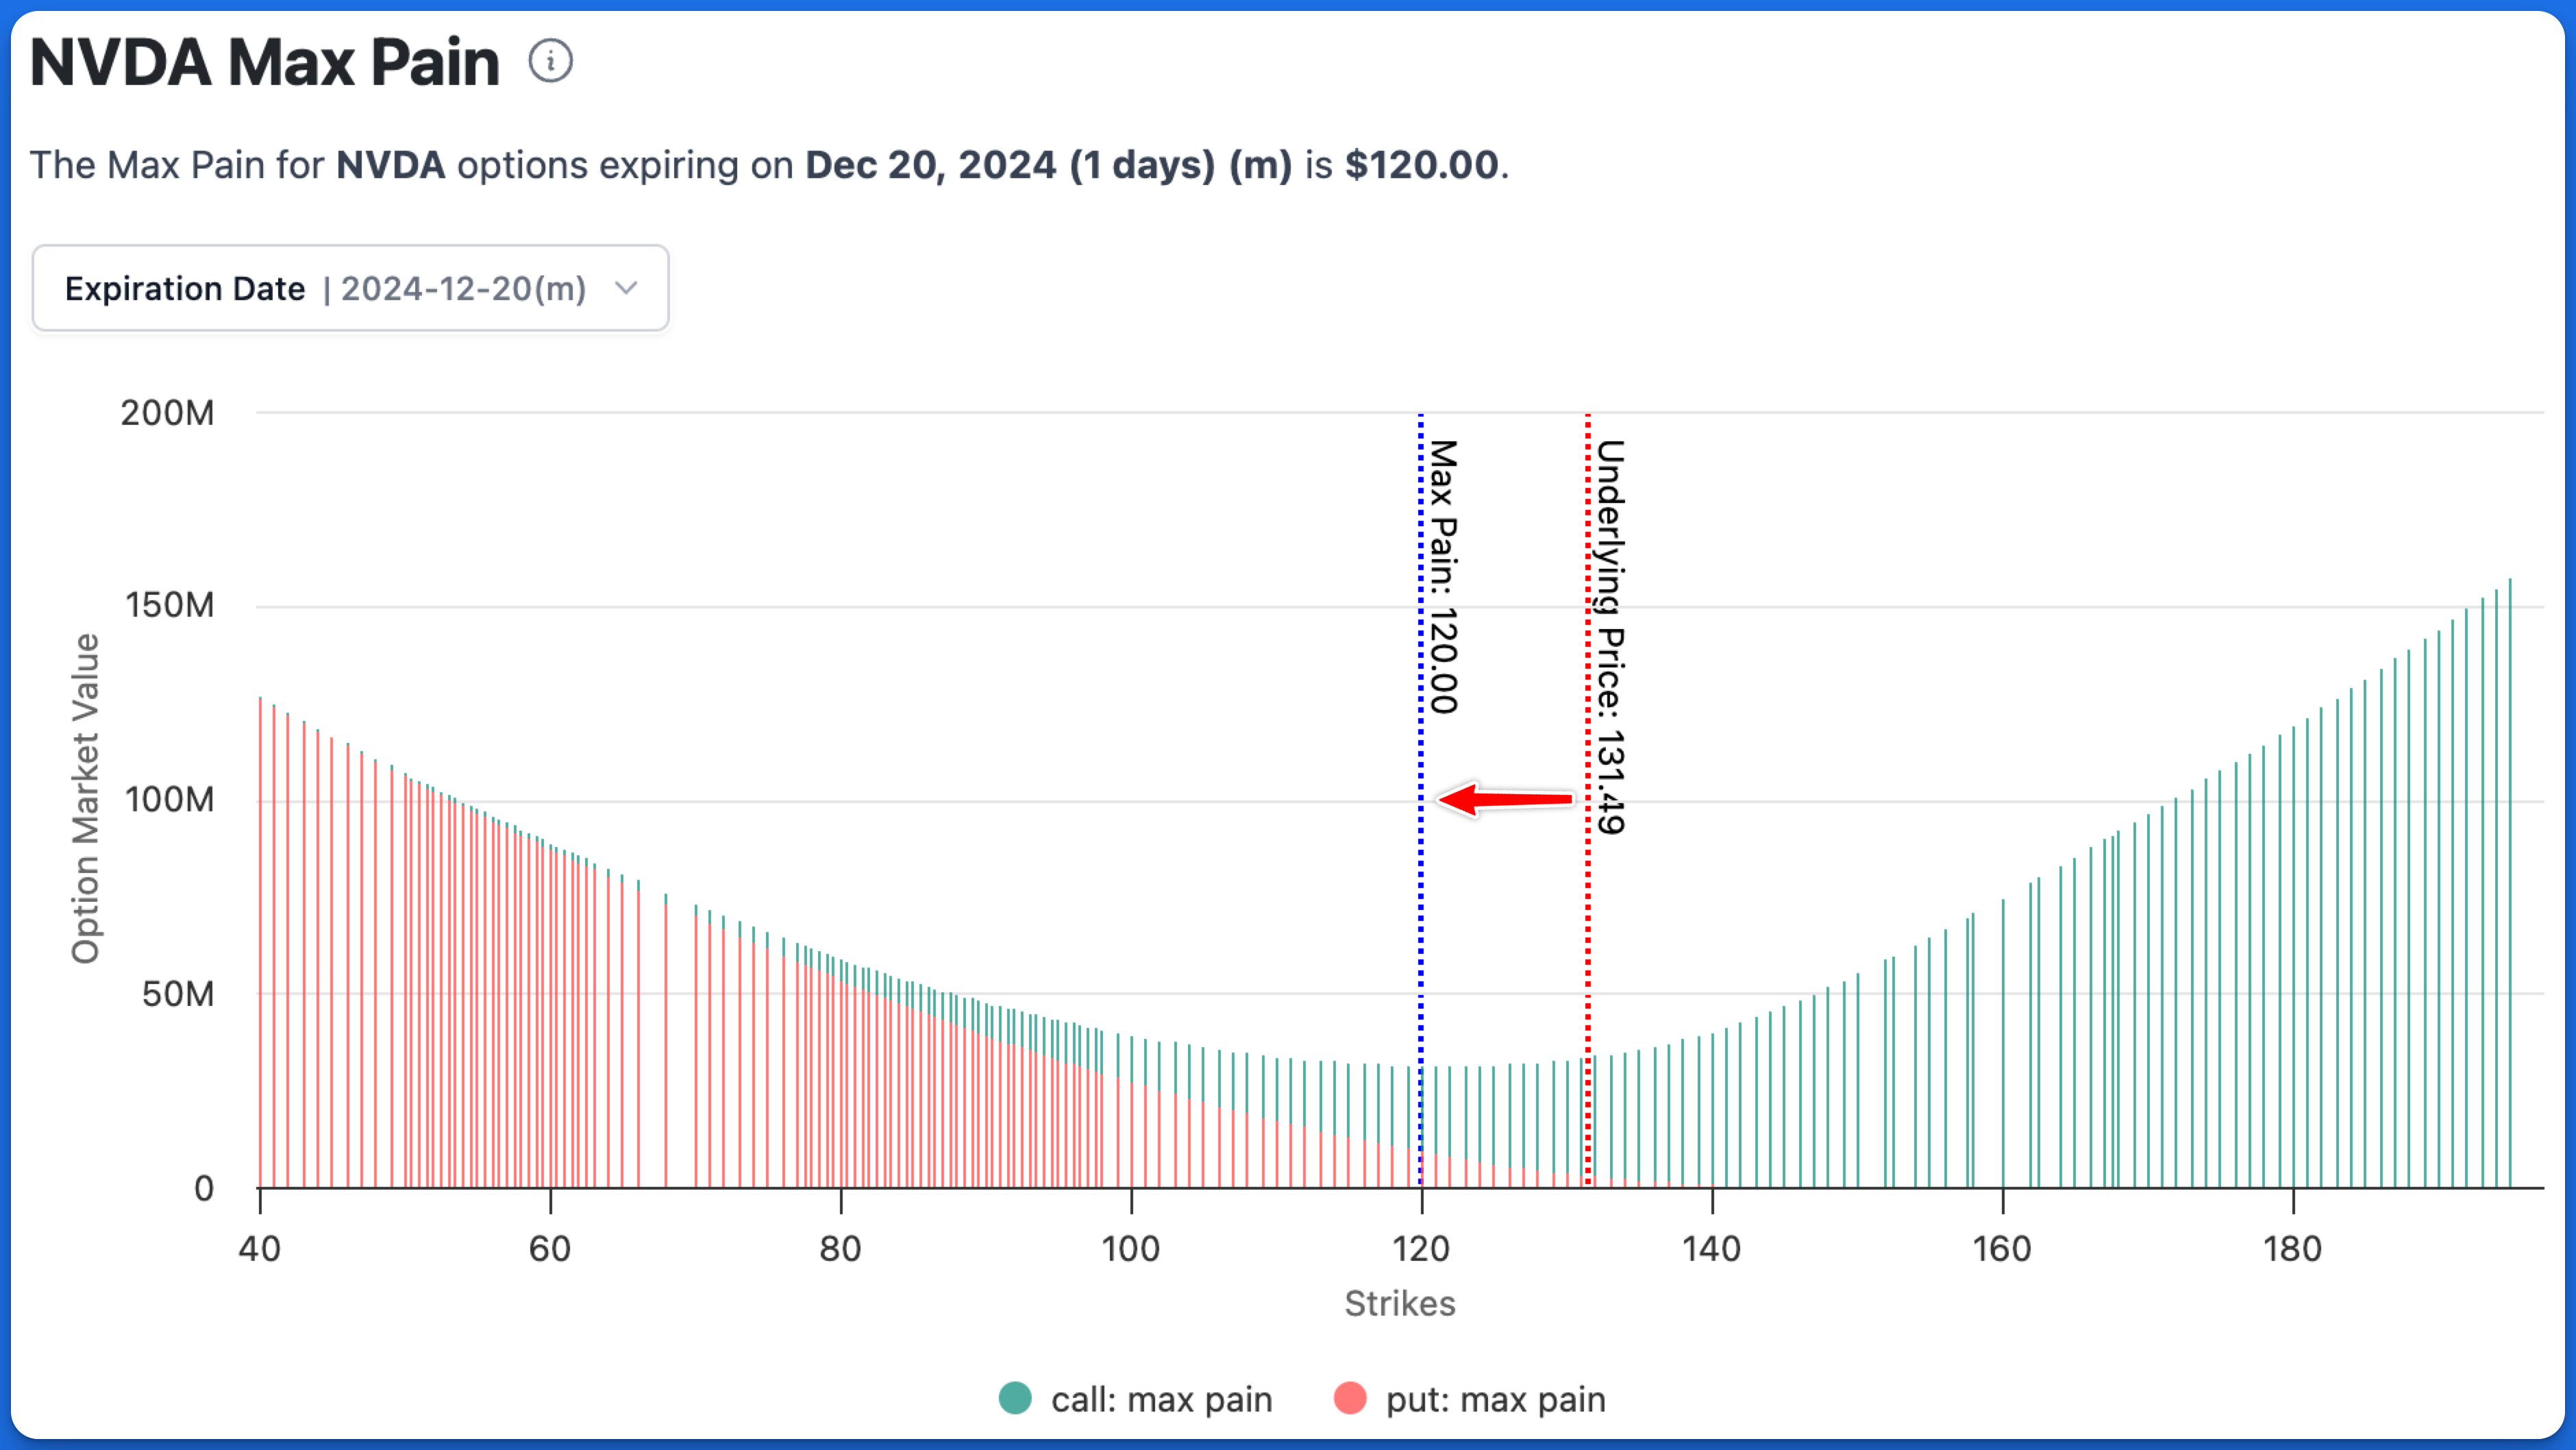
NVDA Max Pain Chart indicating Max Pain value relative to current underlying price.
How Often is Max Pain Calculated
The Max Pain value is updated on OptionCharts at regular market open, which is 9:30 AM EST each trading day. Max Pain is updated only once a day because it is derived from open interest, which is released each morning by the Options Clearing Corporation.
How to Find Max Pain on OptionCharts
Calculating max pain can be really tedious and annoying to do on your own. At OptionCharts, we strive to bring you the fastest and most accurate solution on the market (we think the best looking one too 😉). Here's how to find max pain on OptionCharts.
-
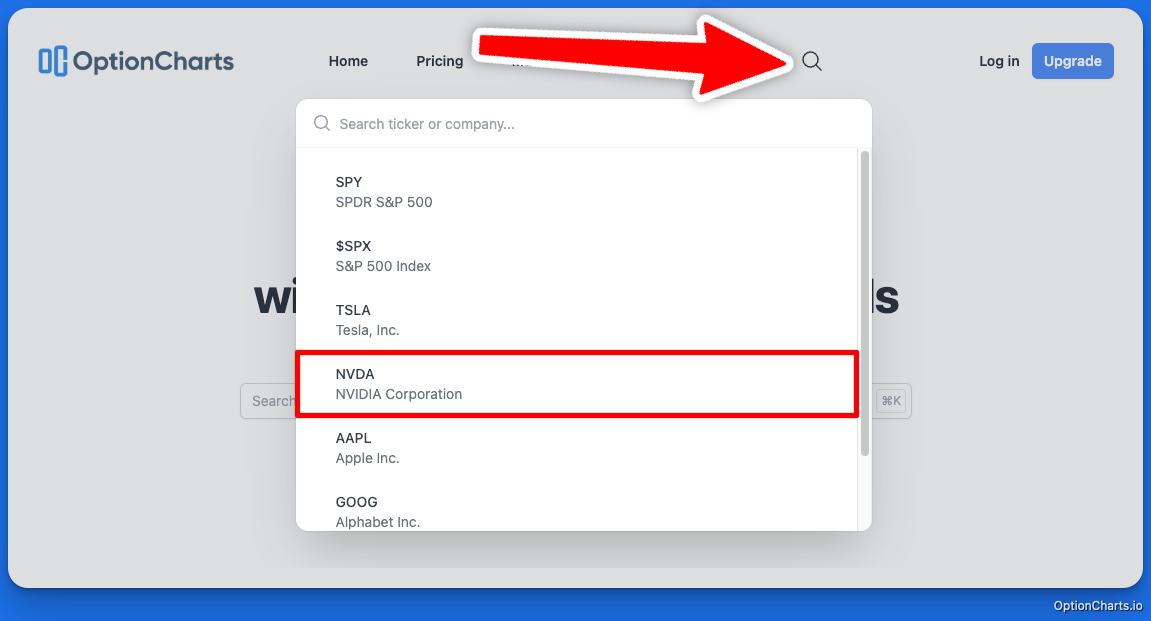
Find the magnifying glass and search for your favorite ticker. Today we'll use NVDA.
-
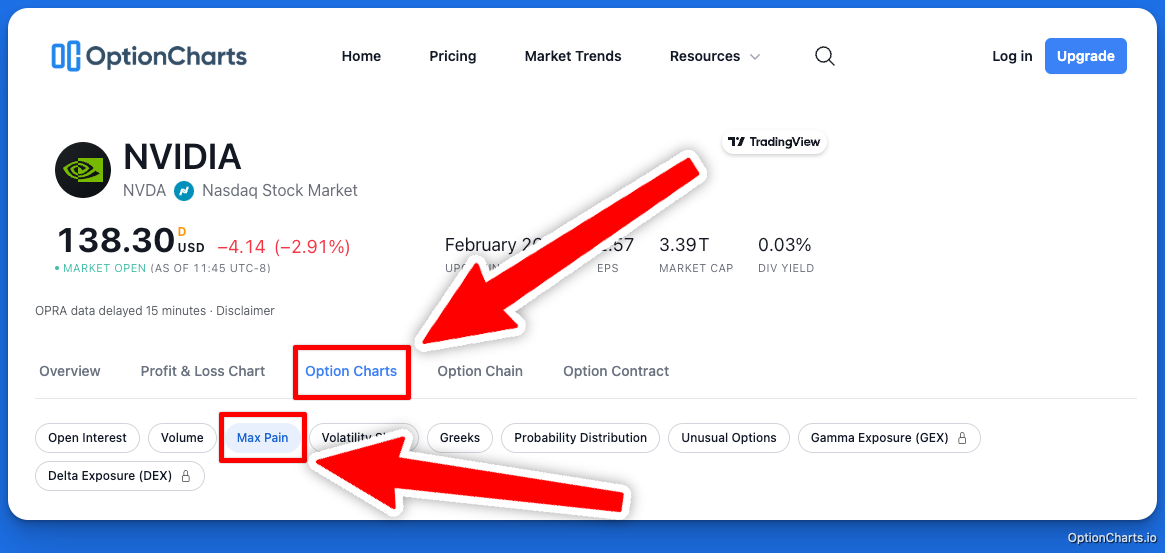
Select the "Option Charts" tab, then select "Max Pain".
-
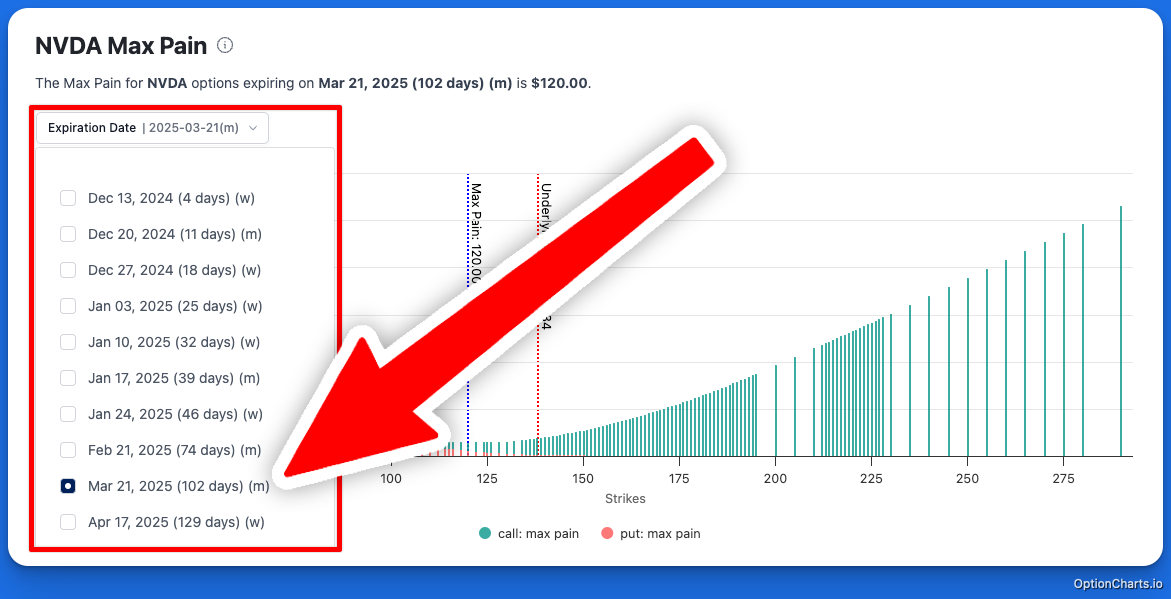
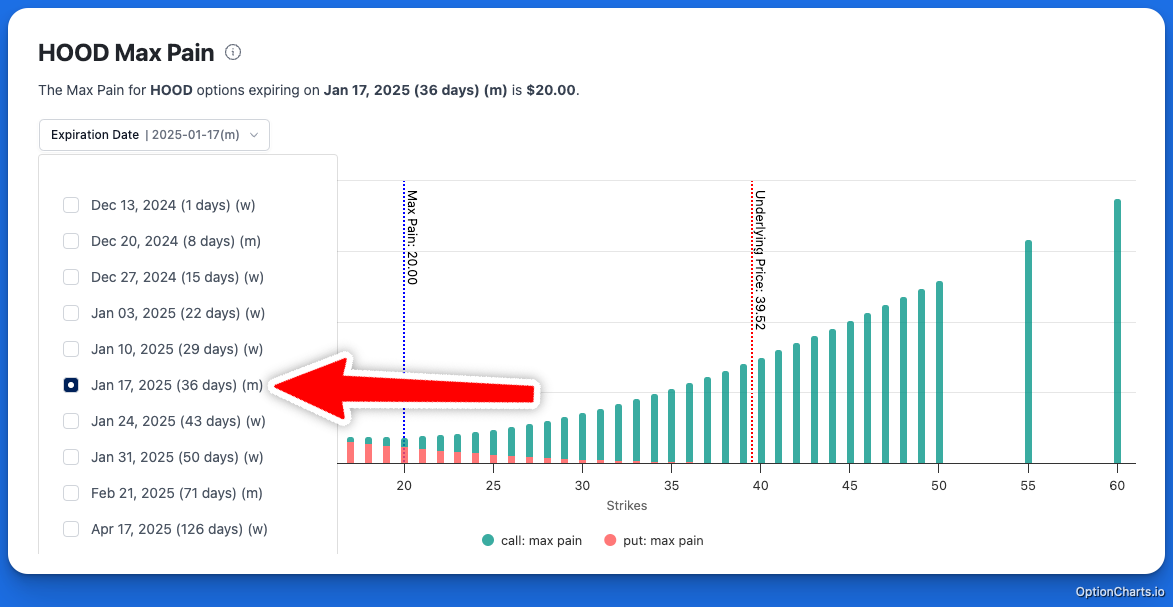
Choose an Expiration Date to analyze from the expiration date dropdown.
-
View Max Pain in the chart which is identified by a vertical, blue dotted line.
Using Max Pain with OptionCharts
OptionCharts provides powerful visualization tools to help traders analyze Max Pain data quickly and efficiently. Our platform offers several key features:
Reliable Data
- Authorized OPRA (Options Price Reporting Authority) data vendor
- Daily Open Interest updated during premarket each morning
- Accurate, institutional-quality options data
Flexible Analysis
You choose how you want to view Max Pain.
View Max Pain for a specific expiration date
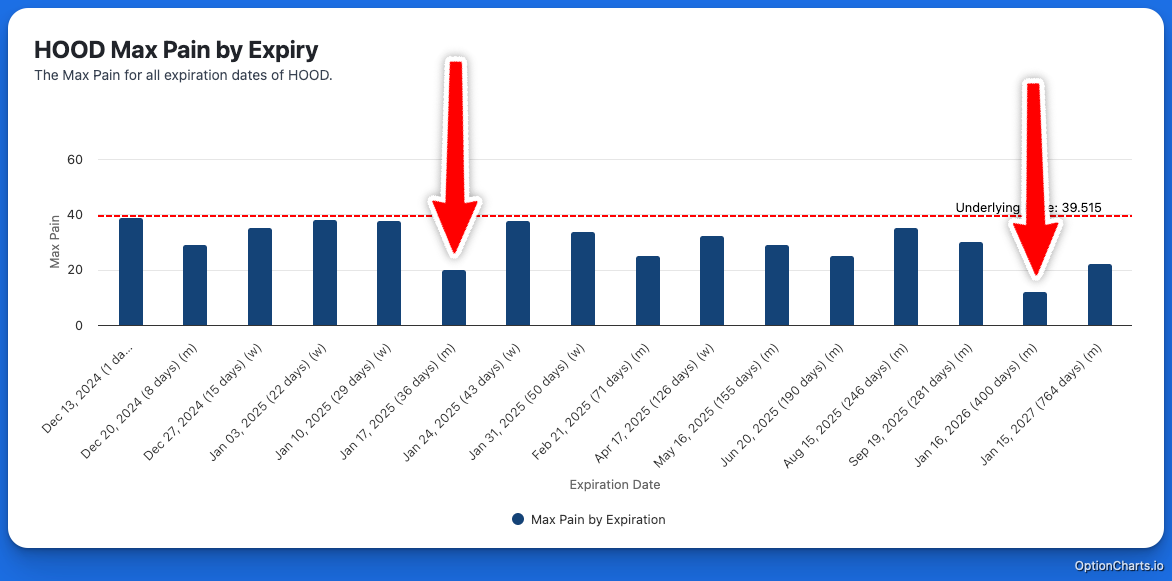
Get a birds-eye view of multiple expirations at once. Less clicking, more trading!
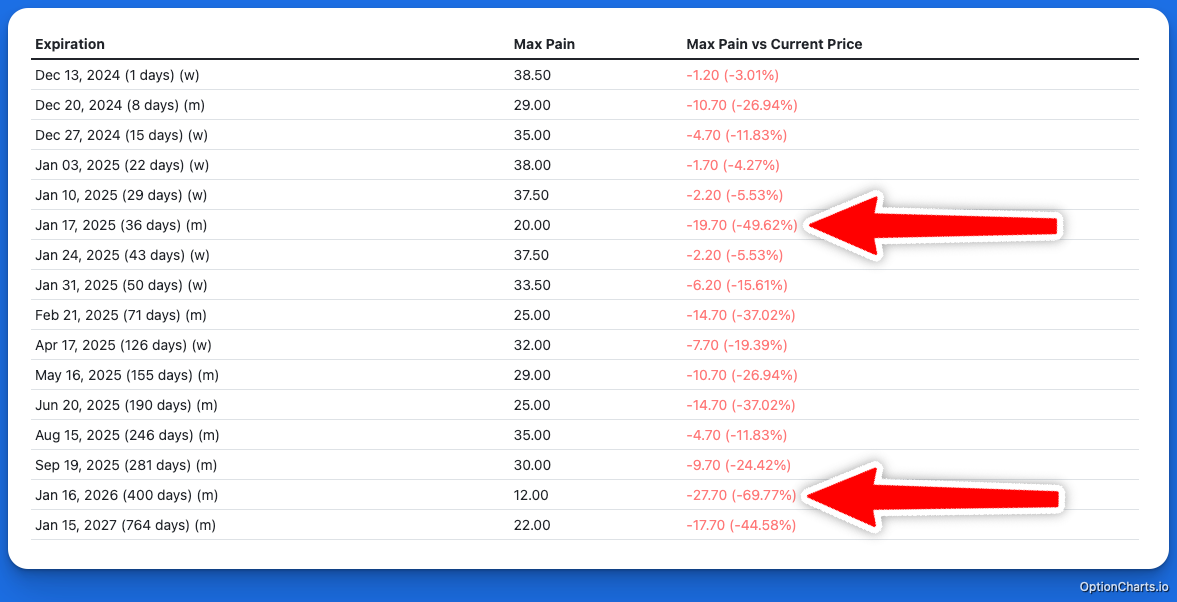
Want more concrete details, like raw Max Pain numbers and percentage differences? We have you covered.
How is Max Pain Calculated?
-
The first step in calculating Max Pain is to identify all strike prices with open interest. This involves collecting data on all strike prices where there are outstanding call and put options for a specific expiration date. Open interest represents the total number of option contracts that remain unsettled, providing a key metric to assess how much money is tied to each strike price.
-
The next step is to calculate the total payoff for each strike price. For every strike, determine the potential payoff for all call and put options, assuming the stock price closes at that strike. This calculation includes both in-the-money and out-of-the-money options. The formulas are as follows:
For calls: Payoff = Max(0, Stock Price - Strike Price) × Open Interest.
For puts: Payoff = Max(0, Strike Price - Stock Price) × Open Interest.
-
To determine the total losses for option sellers at each strike price, combine the payoffs from both call and put options at that strike. Adding these values provides the total cost or liability that option sellers would face if the stock price closes at that specific strike price. This calculation identifies the strike price where option sellers incur the least total loss.
-
The final step is to identify the strike price with the lowest total liability for option sellers. This strike price, known as the Max Pain price, is the level where the total combined cost for option sellers is minimized. Consequently, this is also the price point where losses for option buyers are maximized.
Key Takeaways
- Max Pain is a valuable concept for understanding the potential price level that could cause maximum loss to options holders.
- Max Pain is calculated based on outstanding options contracts and their potential expiration values.
- The Max Pain price is often aligned with market manipulation theories but can provide insights into potential price movement near expiration.
- Max Pain is a theory, not a rule. However, when used in conjunction with other indicators such as volume and open interest, it can help inform traders to make better trades.
FAQs
What does Max Pain tell you?
Max Pain indicates the price level where the option buyers experience maximum loss at expiration, potentially indicating future price movements.
How Reliable is Max Pain?
A research study, “No Max Pain, No Max Gain,” analyzed 25 years of U.S. stock and options data (1996–2021) and found that the theory holds weight, particularly for smaller-cap, less-liquid stocks. By comparing current stock prices to the predicted Max Pain strike price, researchers designed a long-short strategy—buying high Max Pain stocks (expected to rise) and shorting low Max Pain stocks (expected to fall). The strategy generated a consistent weekly return of 0.4%, validating the theory’s potential profitability.
The study also observed price reversals during expiration week, with high Max Pain stocks often recovering sharply, while low Max Pain stocks slightly declined. This was attributed to market dynamics like overreactions to prior trends, potential influence from market makers hedging their positions, and increased trading volumes signaling anticipation of these moves.
However, Max Pain’s reliability is limited:
- It works best one week prior to expiration.
- It is most effective for small-cap, and less-liquid stocks.
- It shows weaker results for large-cap stocks and doesn’t apply to index options like $SPY or $QQQ.
In summary, Max Pain can be a useful tool for traders, particularly when trading smaller stocks near expiration. While it’s not foolproof, it offers a compelling edge when used strategically in the right conditions. If you'd like to read more of our blog post on the research study, you can find it here: How Accurate is Max Pain in Option Trading?.
When is Max Pain most reliable?
Max Pain is most reliable during the week leading up to options expiration, as this is when price reversals predicted by the theory are most likely to occur. It is particularly effective for small-cap, less-liquid stocks, which are more susceptible to price movements influenced by market dynamics such as hedging activity or overreactions to prior trends. Max Pain is less effective for large-cap stocks, which tend to have more efficient pricing, and it doesn’t apply to index options like $SPY or $QQQ, which are harder to influence and less prone to dramatic swings.
How far in advance should I look at Max Pain?
Max Pain is most relevant during the week leading up to options expiration, as this is when the predicted price movements and reversals are most likely to occur. While it can be useful to monitor Max Pain values earlier, the strongest effects and most actionable insights typically emerge in the final days before expiration. This is because market dynamics, such as hedging adjustments and increased trading activity, intensify as expiration approaches. For traders, focusing on Max Pain in the last week provides the best opportunity to align strategies with these predictable patterns.
Why do prices tend to move toward Max Pain?
Prices often gravitate toward Max Pain levels because market makers, who typically have significant capital and influence, hedge their positions by buying or selling the underlying stock. This hedging activity, especially as options near expiration, can impact stock prices and align them closer to the Max Pain level. Additionally, options sellers aim to minimize their potential losses, further contributing to price movements around this level.
How often does the stock price actually hit Max Pain?
The stock price doesn’t always hit the Max Pain level, but it often moves closer to it as options expiration approaches. Research and anecdotal evidence suggest that while the Max Pain level can influence price behavior, it is not a guaranteed outcome. Factors such as market sentiment, unexpected news, or broader market trends can cause prices to deviate from Max Pain.
However, for smaller, less-liquid stocks, the price tends to align with Max Pain more frequently, as they’re more influenced by the hedging activities of market makers and options dynamics. Thus, while Max Pain is a useful tool for identifying potential price trends, it should be viewed as a probabilistic indicator rather than a certainty.
What are the limitations of Max Pain theory?
Max Pain theory has several limitations that traders should consider.
First, it is not a guaranteed predictor of price movement, as external factors like market news, economic data, or broader market trends can override options-driven dynamics.
Second, the theory is most effective for smaller, less-liquid stocks and tends to show weaker results for large-cap stocks or index options like $SPY or $QQQ, which are less prone to manipulation and have more efficient pricing.
Additionally, Max Pain relies on accurate and up-to-date open interest data, which is only updated once daily. This means sudden changes in market conditions or new positions taken after the data update may not be reflected.
Finally, the theory works best during the week leading up to options expiration and may not provide actionable insights outside this time frame. While useful, Max Pain should be used alongside other tools and strategies for a well-rounded trading approach.