Option Market Trends
Enhance your option trading
Explore powerful charts and tools to help you identify potential trade opportunities and enhance your trading.
-
Intuitive Visualizations
- Explore intuitive visualizations designed to simplify complex option data.
-
Comprehensive Option Chart Library
- Access 20+ charts per ticker, giving you comprehensive insights into the options market.
-
Responsive, Full-Screen Charts
- Gain deeper insights with responsive, full-screen charts.
-
Unique Data and Insights
-
Access unique data and insights tailored to options traders, not found on other platforms.
Unlock deeper insights.
Make better trades.
Charts and tools to help you make better trading decisions and improve your chances of market success.
OptionCharts makes complex data simple, saving time on analysis and enhancing your trading decisions. We offer a suite of powerful charts to provide unique insights into the options market.
How We're Different
OptionCharts sets itself apart by focusing exclusively on the options market. We offer unique tools and insights tailored specifically for option traders—resources you won't find anywhere else, all in one place. Our modern, streamlined interface cuts through the complexity, enabling you to make informed decisions more quickly.
Whether you're a seasoned professional or just beginning your journey into options, OptionCharts is here to help you succeed. Take your trading to the next level. Upgrade today to unlock the full potential of OptionCharts.
Features
Charts Built for Options Traders
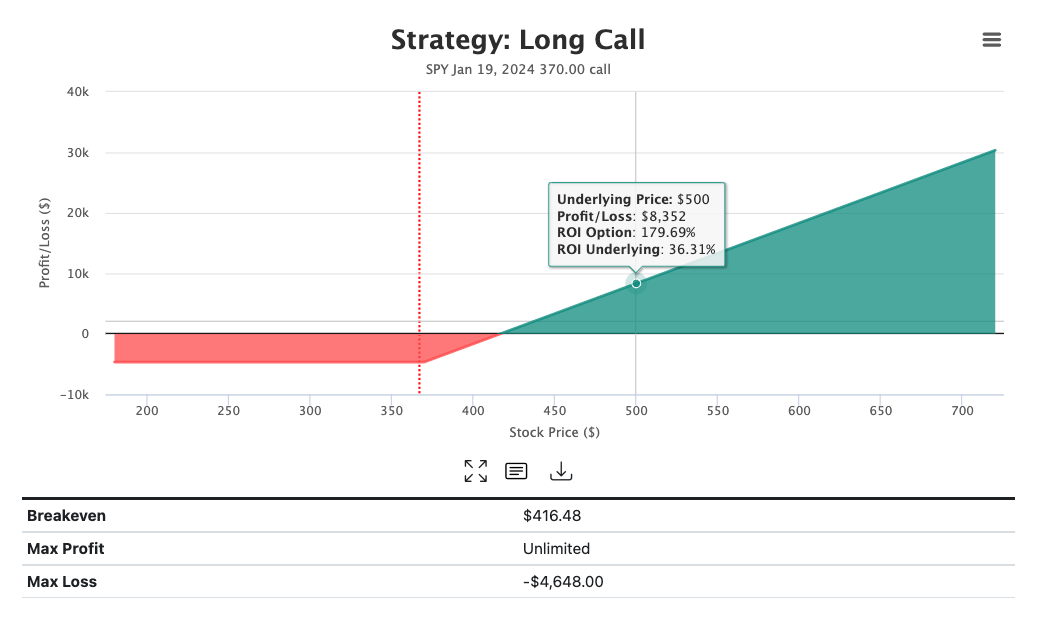
Profit & Loss Chart
The Profit and Loss Chart helps traders evaluate potential outcomes of option trades by displaying the theoretical profit and loss of a strategy at different stock prices.
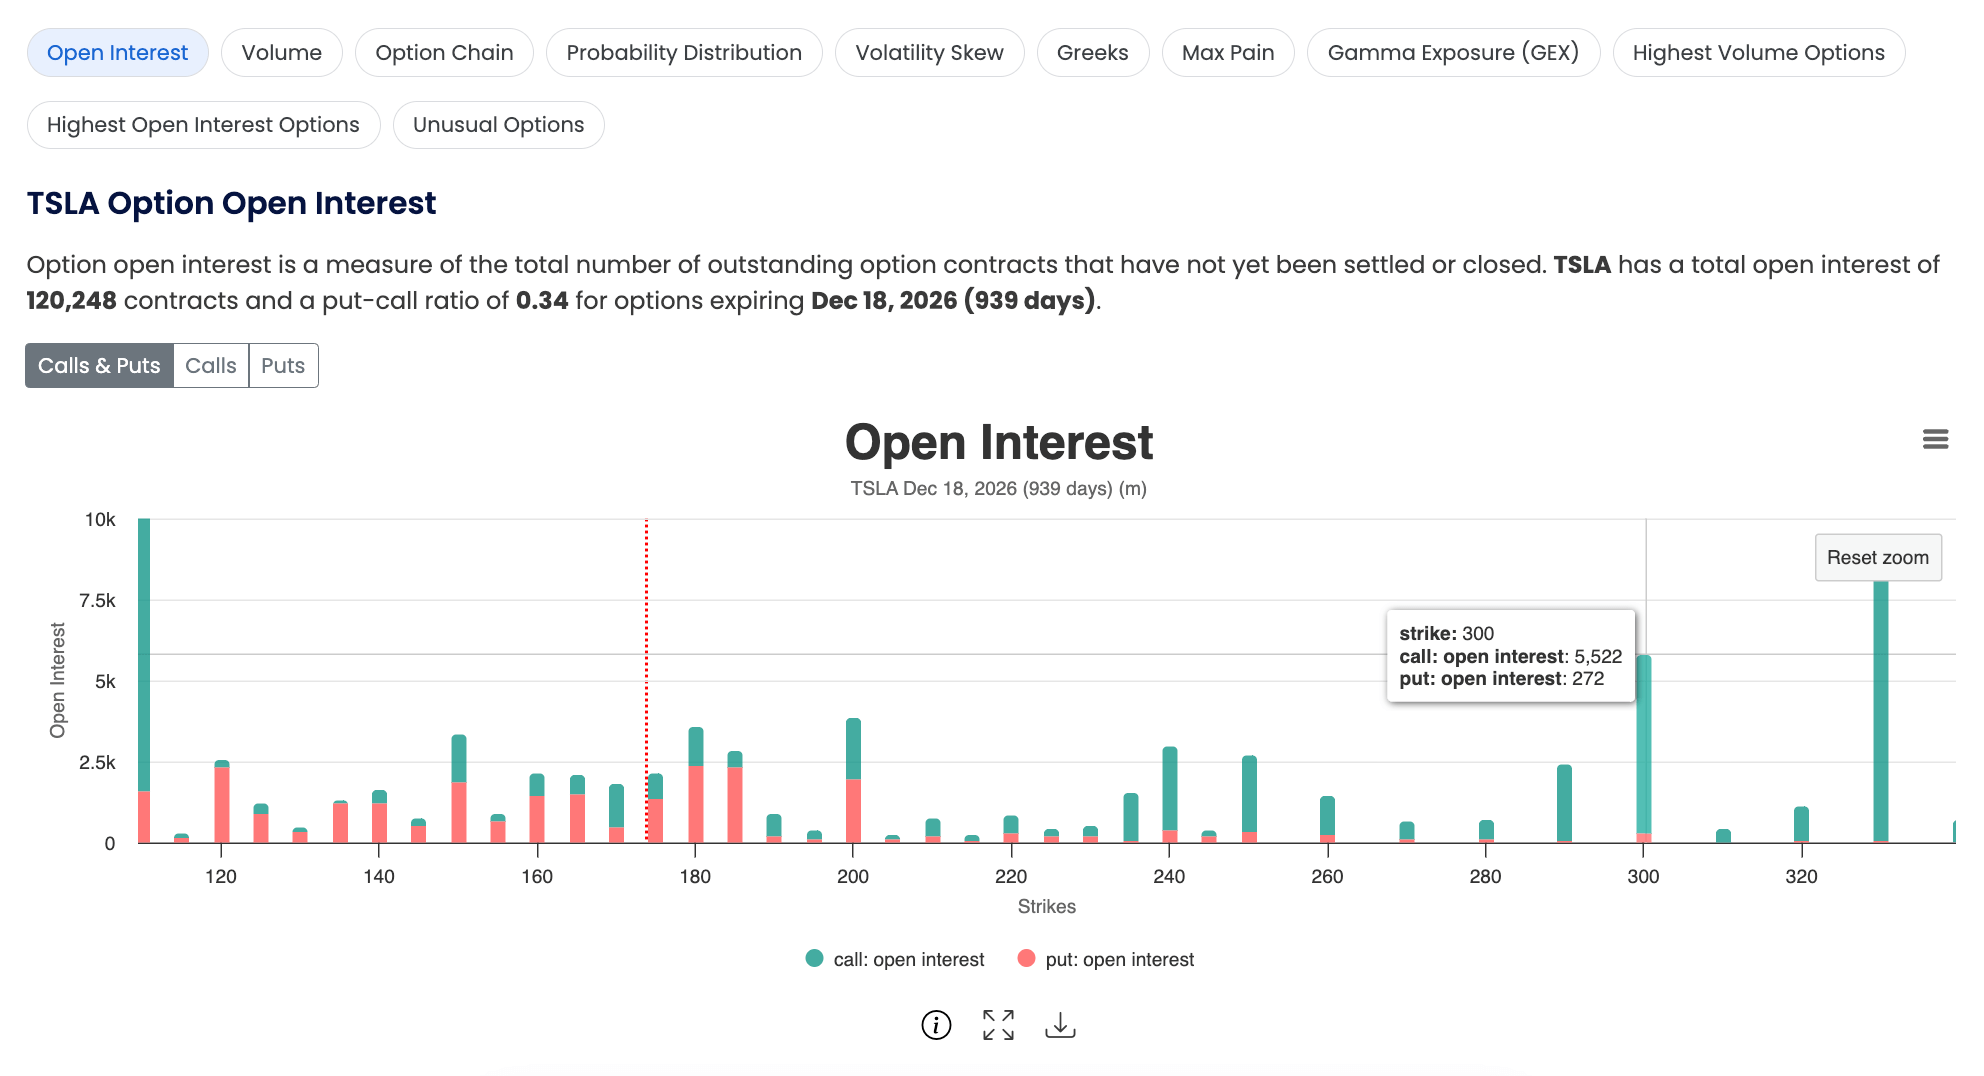
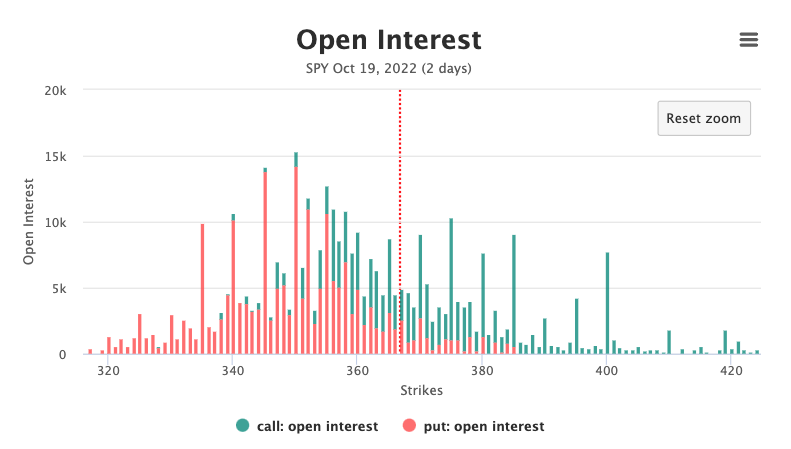
Open Interest
The open interest chart shows the number of open contracts for an option. It can be used as an indicator to gauge market sentiment.
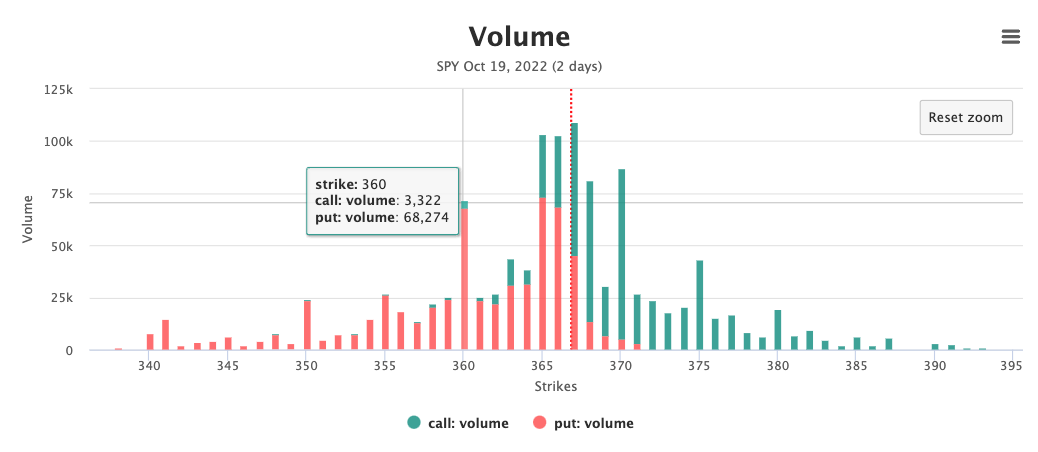
Option Volume
The volume chart displays the number of options contracts bought or sold at each strike during current trading session. Investors can use it as an indicator of market trends and option liquidity.
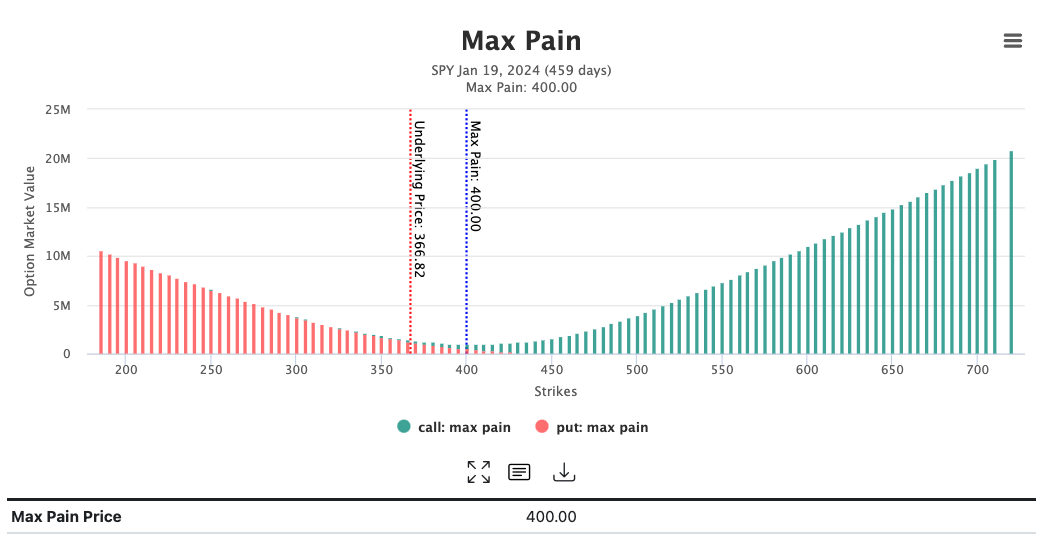
Max Pain
The Max Pain Chart is a visual representation of the Max Pain Theory. It illustrates the price at which the stock would cause financial losses for the largest number of option holders at expiration.
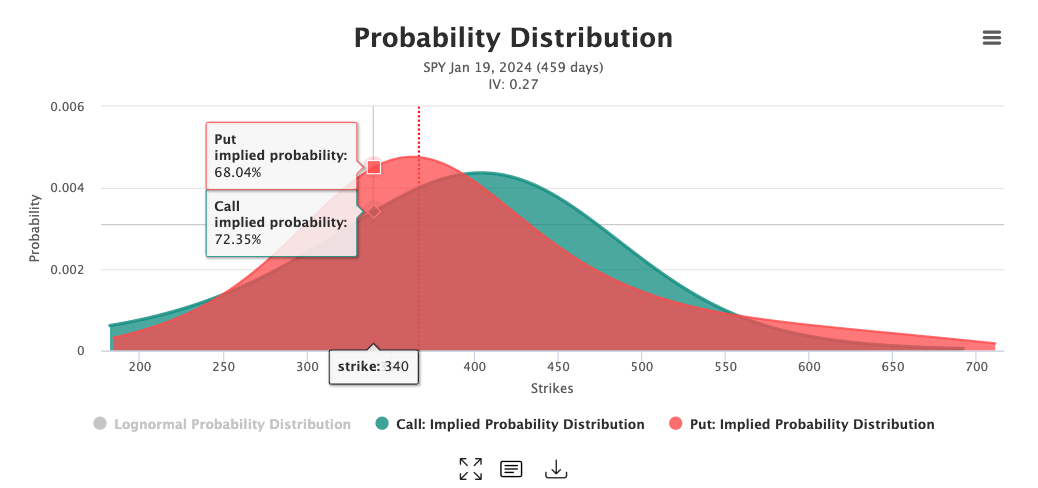
Probability Distribution
The Probability Distribution Chart illustrates the market's perceived likelihood of various outcomes. It displays both the lognormal probability distribution based on the Black-Scholes model and the market-implied probability distribution derived from current option prices.
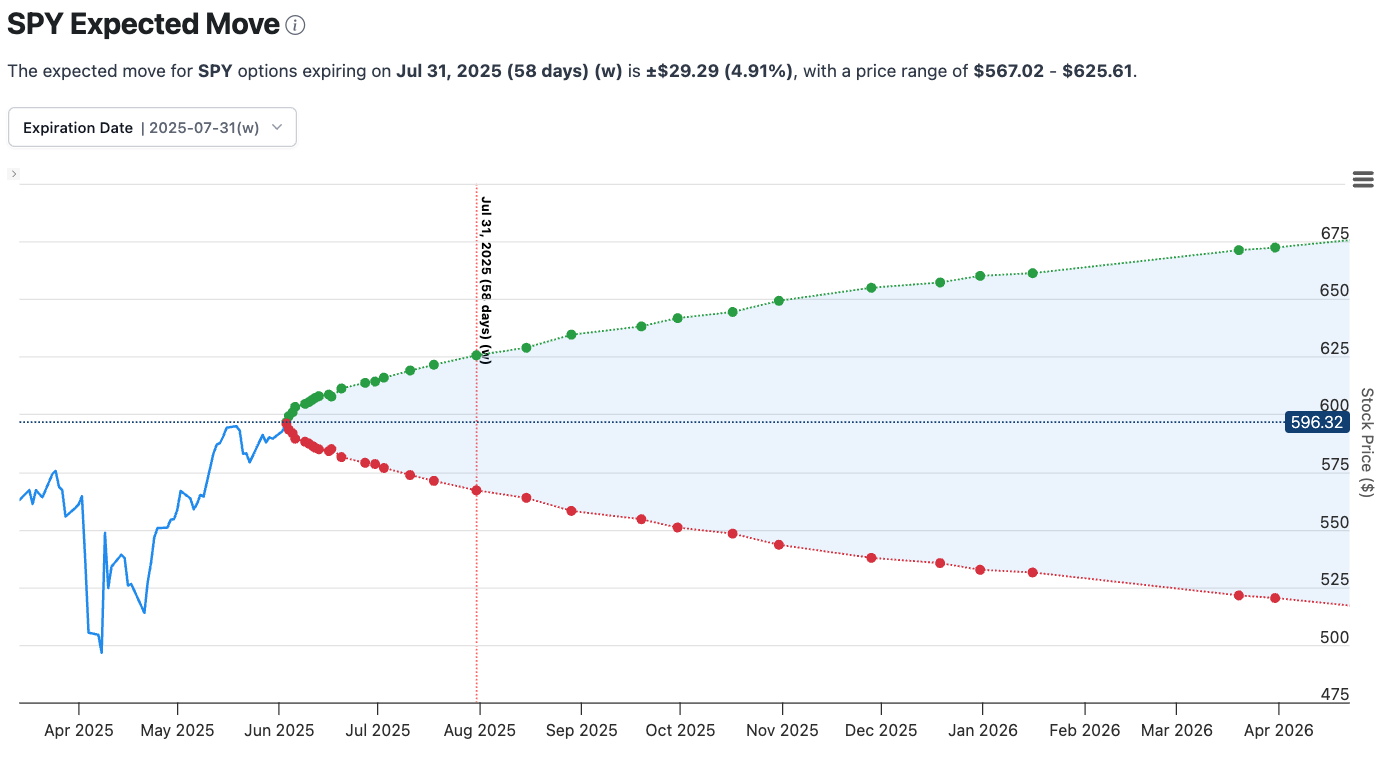
Expected Move
The Expected Move chart shows the amount a stock is anticipated to move as implied by current option prices.
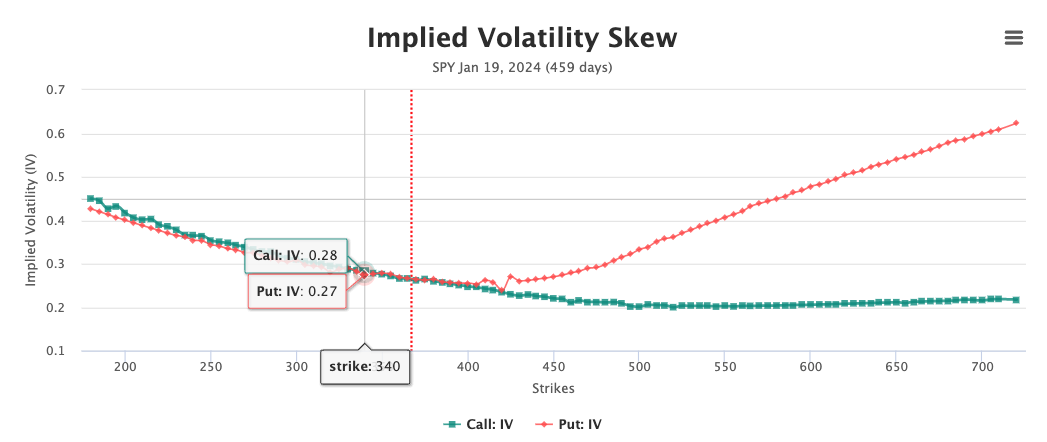
Implied Volatility Skew
The Implied Volatility Skew Chart displays the implied volatility (IV) across all strikes for both call and put options. Investors can examine the volatility skew to identify low and high-priced contracts, which can help them decide whether to buy or sell.
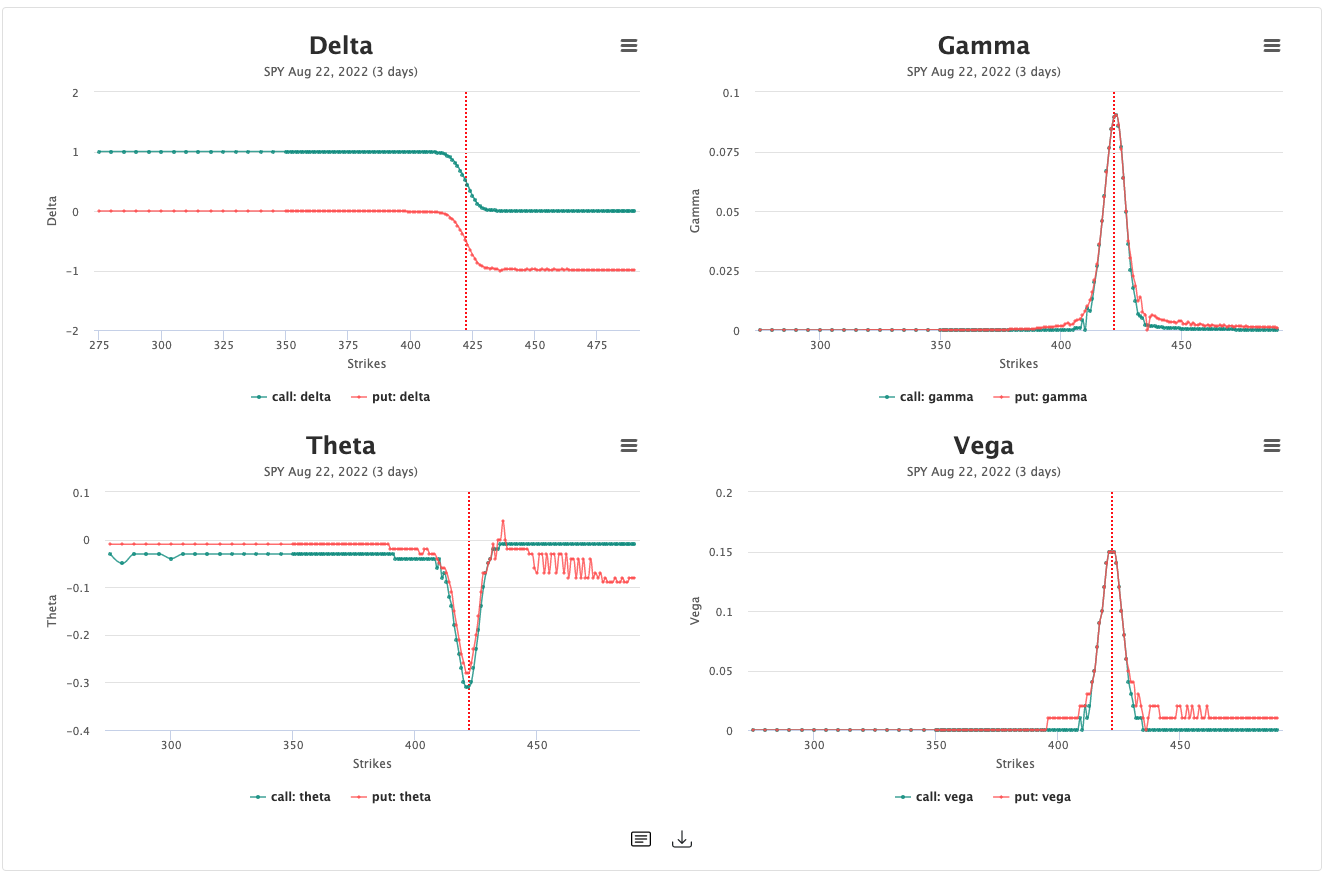
Greeks
The Greek Charts display Delta, Gamma, Theta, and Vega for calls and puts across all strikes. Greeks are calculated from current market prices using the Black-Scholes model.
Gamma Exposure (GEX)
The Gamma Exposure Chart ('GEX') shows the estimated dollar amount that market makers must hedge for every 1% change in the spot price to remain gamma neutral. This chart helps traders anticipate potential buying or selling pressure from dealer hedging.

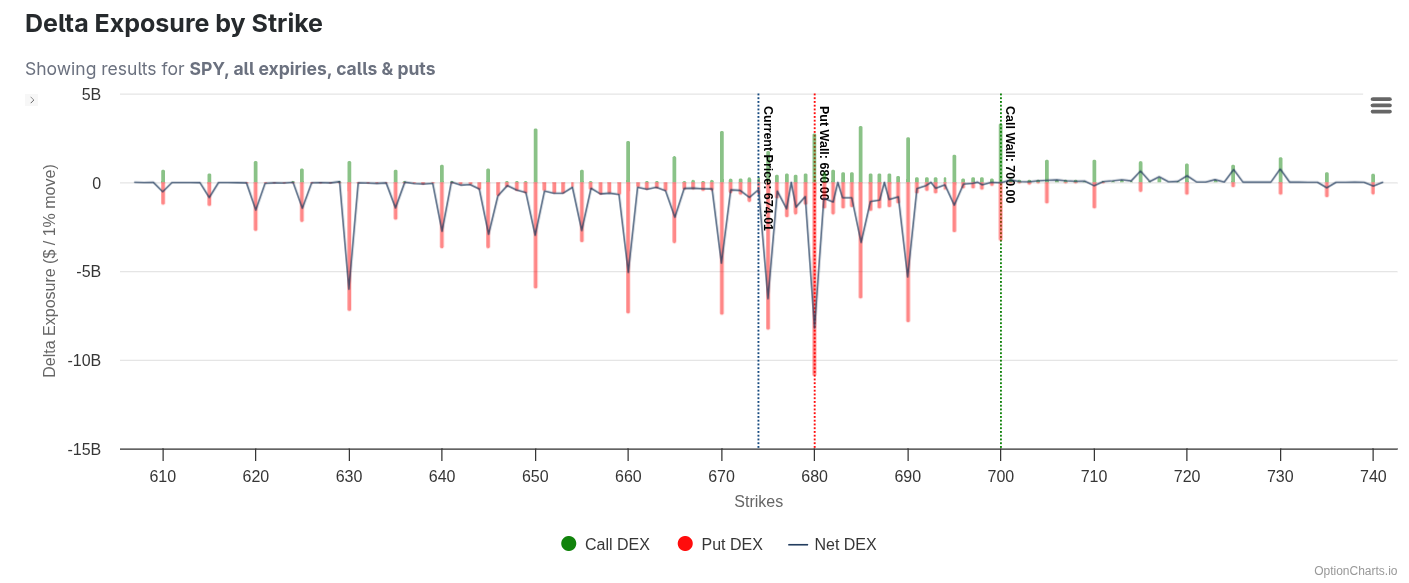
Delta Exposure (DEX)
The Delta Exposure Chart ('DEX') shows the estimated dollar amount that market makers must hedge for every 1% change in the spot price to remain delta neutral.
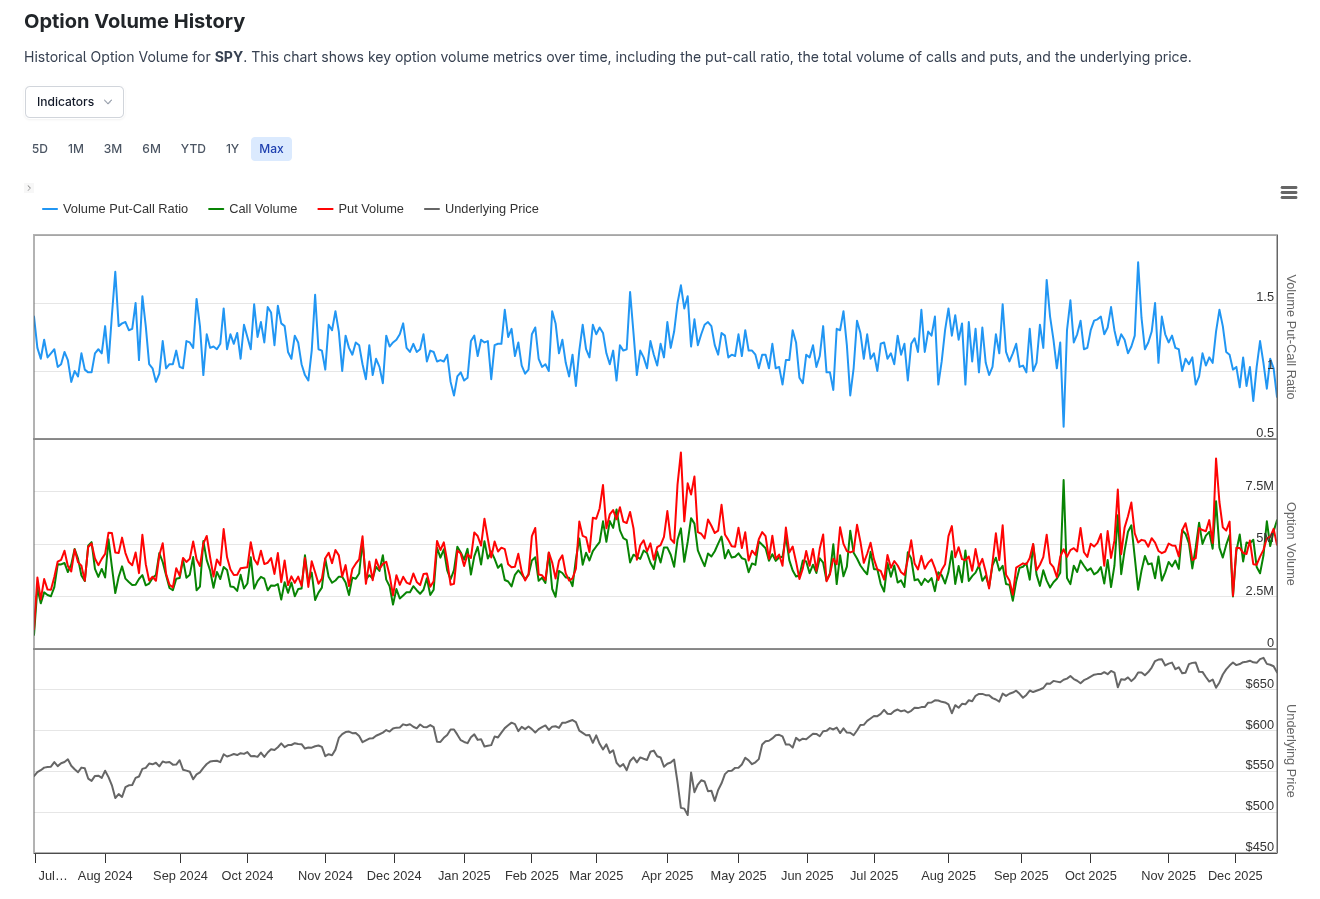
Historical Data
Historical Data provides a view of key option metrics and statistics over time for any ticker. Track dozens of important statistics including implied volatility, put-call ratios, open interest, volume, and other metrics to analyze trends and historical patterns.
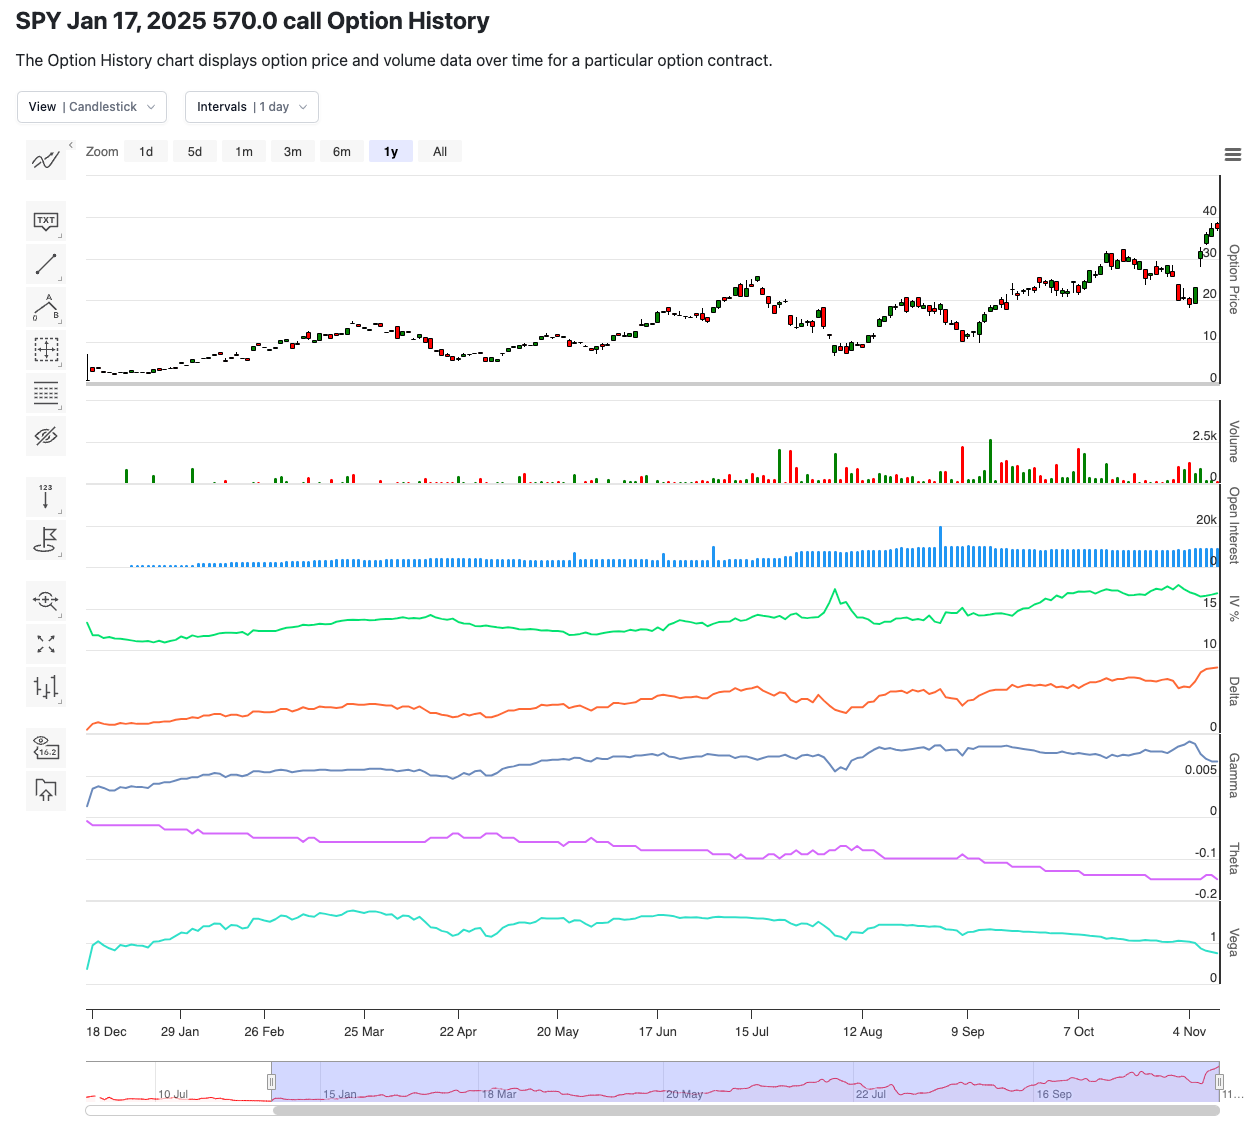
Contract History
The Contract History chart shows the price, volume, open interest, and greeks of a specific option contract over time. This chart provides traders with a visual representation of the historical performance of a contract.
Ready to take your options trading to the next level?
Leverage unique tools and charts to improve your trading.