Introducing the Expected Move Chart

Patrick Grenning
Founder
The Expected Move chart is now available on OptionCharts. This new chart is available free for all OptionCharts users.
What is Expected Move?
Expected move represents the market's prediction of how far a stock's price might move by a specific date. It's derived from the current market price of options. It's a key statistical metric that traders use to estimate the potential range of a stock price over time.
The expected move is based on a one standard deviation range, meaning there is a 68% probability of the stock price ending within the expected move range. For example, a stock that has a price of $100 with an expected move of $5.72 in 30 days suggests there is a 68% probability of the stock price being within the range of $94.28 to $105.72 at the end of that period.
There are a couple of ways to calculate it. We use the following formula which is based on the current market price of at-the-money (ATM) straddles:
1σ expected move ($) = 60% × Price of ATM Straddle + 30% × Price of Strangle 1 Strike from ATM + 10% × Price of Strangle 2 Strikes from ATM
How do traders use Expected move in option trading?
There are a few ways traders use expected move:
- Understanding market sentiment: The expected move reflects the market's consensus on future volatility. Higher expected moves suggest the market anticipates significant price changes, perhaps due to an earnings report, while lower expected moves indicate calmer expectations.
- Setting Profit Targets and Stop-Loss Levels: The expected move provides a range within which the stock is likely to trade. Traders often use this to set profit targets or stop-loss levels. For example, if the expected move is $5.72 on a $100 stock, a trader might set a profit target at $105.72 and a stop-loss at $94.28.
- Evaluating strategies: Traders can assess whether a trade's potential move justifies their risk. For example, if a trader expects the stock to move beyond the expected range (e.g., more than $5.72), they might buy call or put options to profit from a larger price swing. If they think the stock will move less than the expected range, they might sell options to collect premium, betting that the stock stays within the predicted bounds.
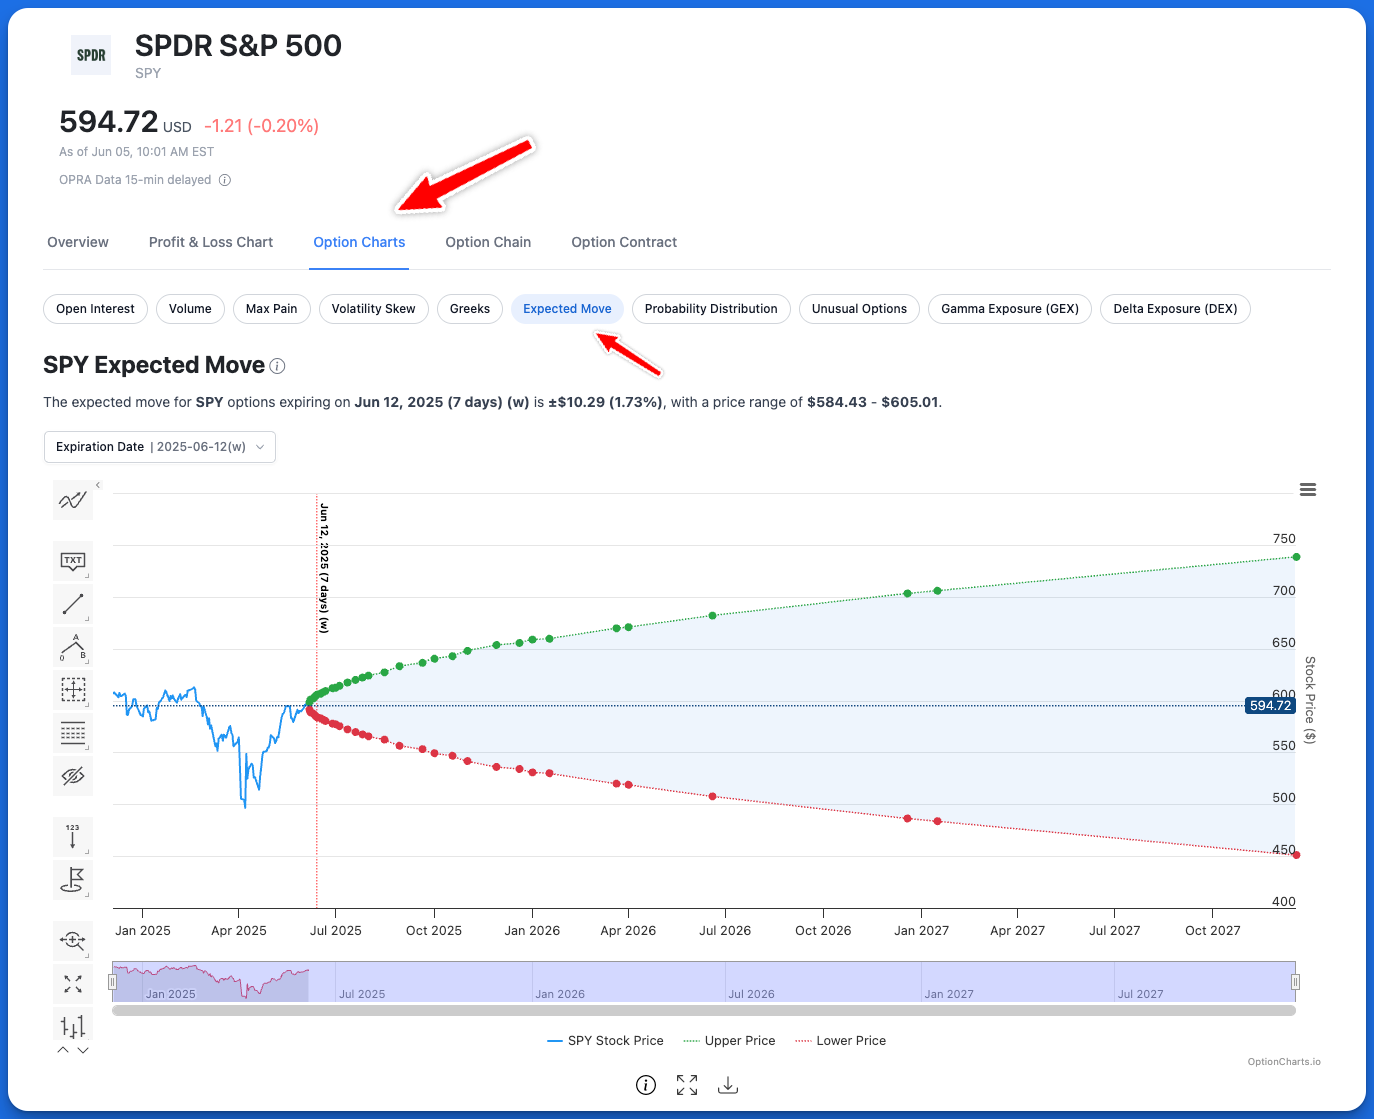
How to View Expected Move on OptionCharts
Here’s how to find the Expected Move chart on OptionCharts.
- Search for your ticker using the search button at the top.
- Click the Option Charts tab.
- Click the Expected Move button.
Understanding the Chart
The Expected Move Chart displays both where a stock has been and where the market expects it to go. The blue line shows historical price movement up to today. From today forward, the chart shows future market expectations — green dotted line marking the upper expected move and red dotted line showing the lower expected move. These boundaries form a shaded area that represents the expected price range. Simply hover over any area of the chart to see its specific move at that date.
Each expiration date is marked by a green or red solid circle on the chart. The expected move widens as you look further out in time. At the top of the chart, you'll always see a dropdown menu for selecting an expiration date. You can change the selected expiration date to highlight on the chart the expected move for that expiration, which is indicated by a vertical red line.
Closing
Expected move shows you where the market thinks a stock will trade in the future. Use it to validate trade ideas, set profit targets and stop losses, and spot when option pricing suggests unusual volatility. Try it now on your favorite stocks.
We're working hard to enhance our charts based on your feedback. The expected move was requested by option traders like you. Thanks for helping us improve!