Enhancements to the Option Contract History Chart

Patrick Grenning
Founder
We made several key improvements to the Option Contract History Chart.
All Indicators Now Work with Intraday Data
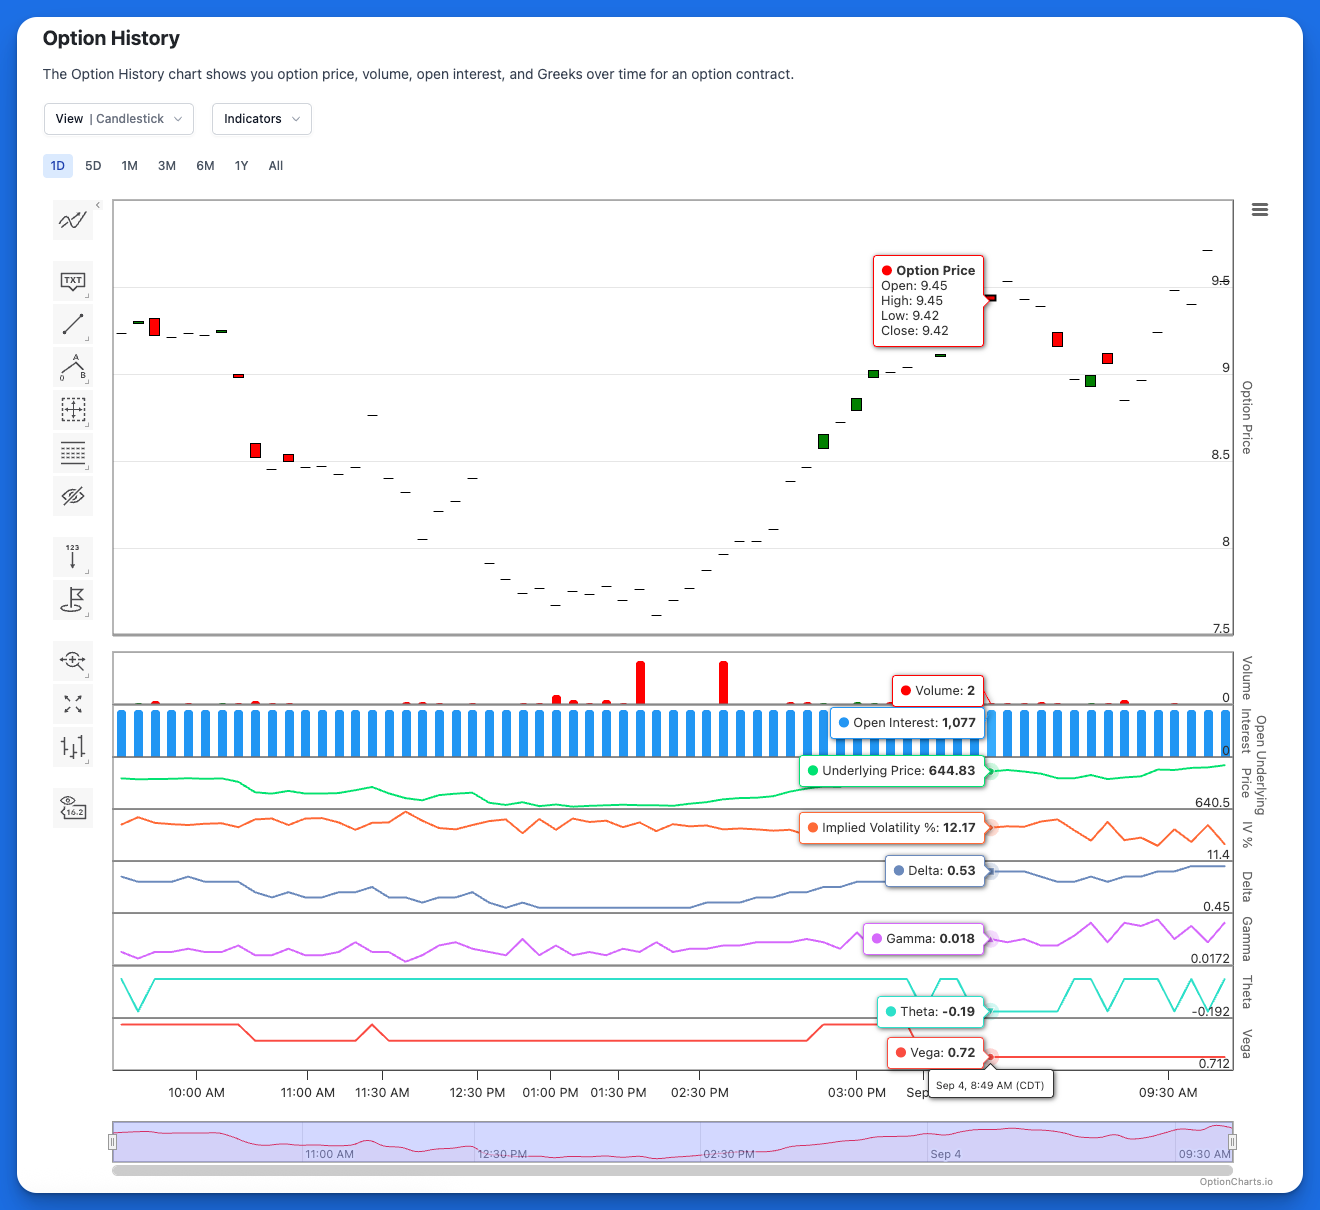
All of the indicators on this chart now work with intraday data. Previously Greek and OI only worked when using 1-day intervals. Now you can view these metrics with intraday, 1-minute intervals. Click "1d" time period to access intraday intervals.
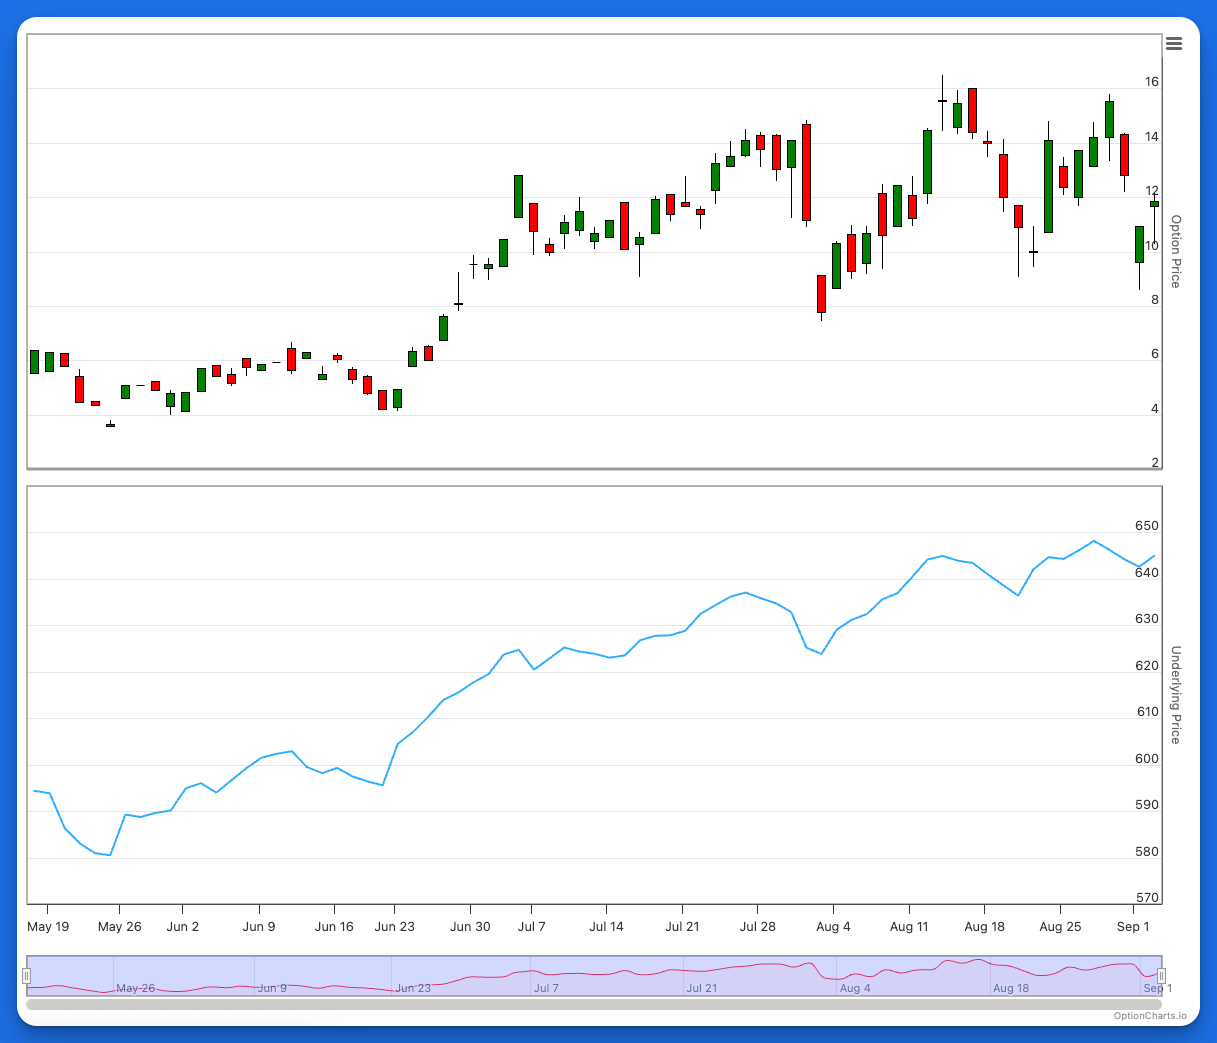
New Underlying Price Indicator
We added "Underlying Price" as a new indicator. You can now compare the option price to underlying price on one chart.
Design Improvements and Bug Fixes
We also made several design improvements and bug fixes.
The Option Contract History Chart provides a comprehensive view of how your option contracts perform over time, showing price, volume, open interest, and Greeks data. With these improvements, you now have even more granular control and insights into your option positions.