Announcing Upgrades to our Profit & Loss Chart

Patrick Grenning
Founder
We just released a significant upgrade to our Option Profit & Loss chart! These enhancements are designed to provide you with powerful insights to help you choose a profitable option strategy and help you make more informed trading decisions. Let's dive into the new features.
1. New Probability and Risk Metrics
We've added several new fields to give you a clearer picture of your potential outcomes:
- Probability of Profit: This metric shows the likelihood of your strategy ending in profit at expiration.
- Probability of Max Profit/Loss: These fields indicate the chances of reaching maximum profit or loss.
- Expected Value (EV): This metric represents the average outcome of your trade if repeated many times.
- Expected Return: Shows your potential return as a percentage of your initial investment.
- Reward/Risk Ratio: This metric helps you compare the potential max reward to max loss.
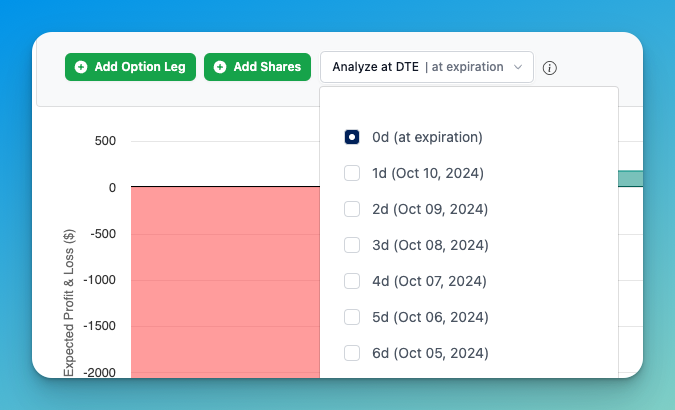
2. Analyze at DTE
One of our exciting additions is the Analyze at DTE (Days to Expiration) feature. We've heard your feedback and interest in this feature. This tool allows you to visualize your strategy's performance at different periods of time before expiration.
- Default setting (0 DTE) shows the payoff at expiration.
- Adjust to positive values (e.g., 7, 14, 30) to see performance that many days before expiration.
- Understand how time decay affects your strategy and plan optimal entry or exit points.
3. Edit Option Price and Share Price
You can now edit option prices or share price directly in the form. This feature allows you to calculate payoffs based on different price scenarios: bid, mid, ask, or enter a custom price. Analyze how price changes affect your overall strategy.
4. Select Option by Delta
We've added delta as an input in the option leg selector. Now you can choose options based on their delta value, giving you more control over your strategy construction.
5. Sleek New Design
Last but not least, we've given the entire chart a fresh, modern look to enhance your user experience.
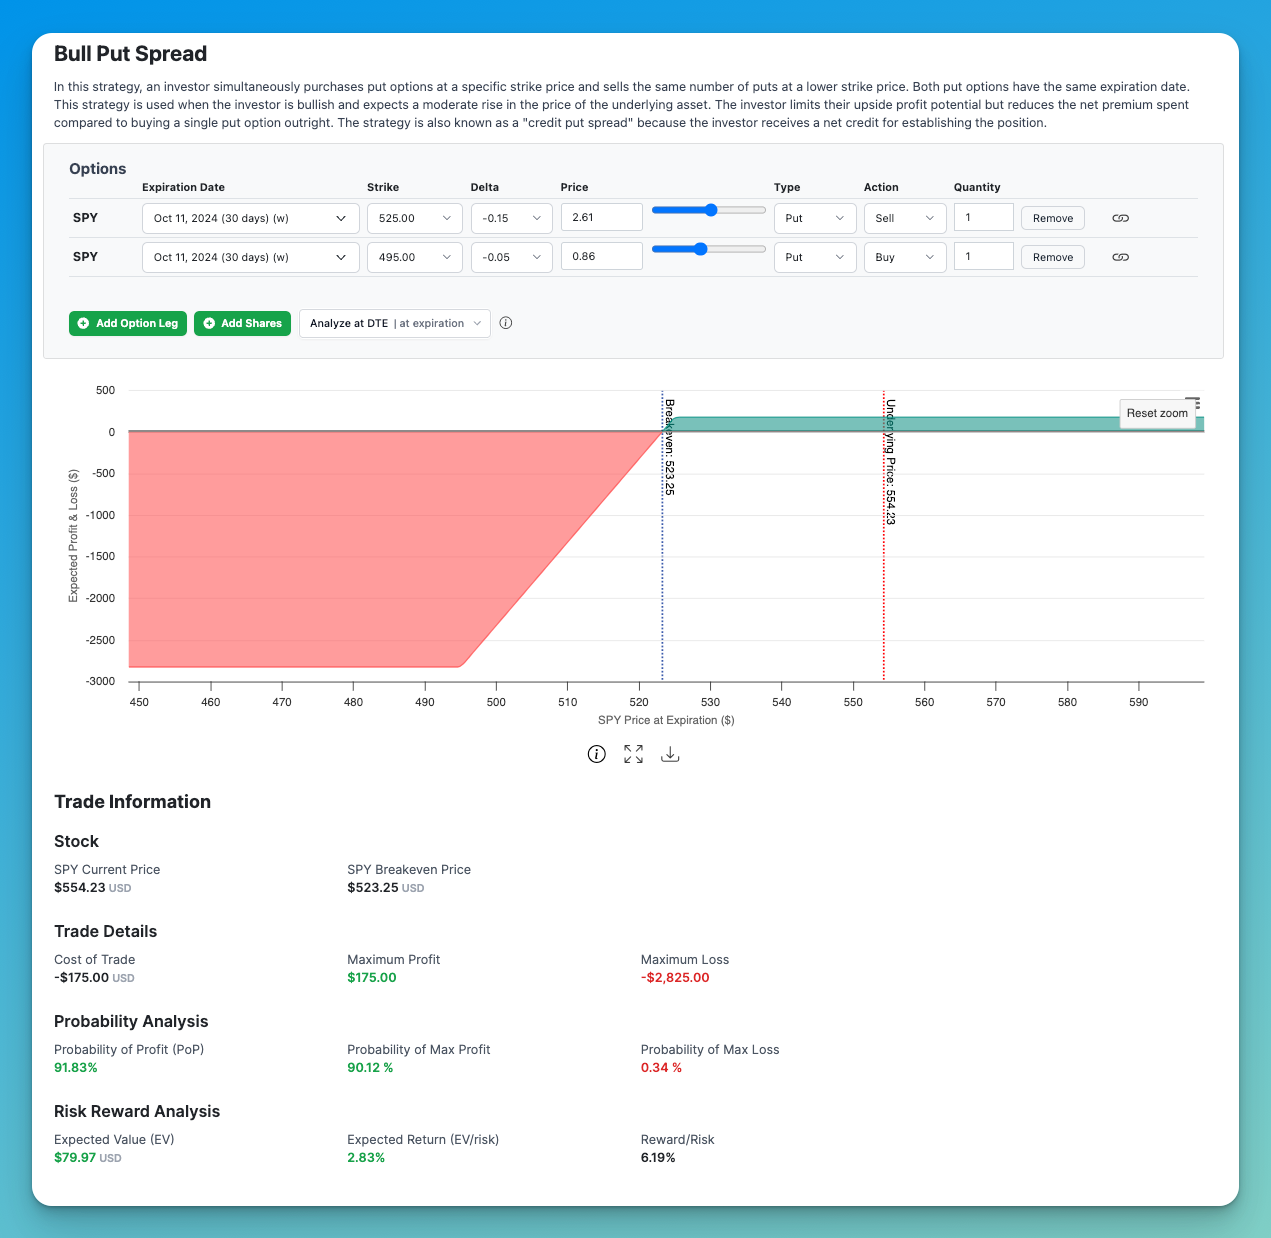
A Walkthrough: Analyzing a Bull Put Spread
Let’s walk through an example of how to use these new features by analyzing a Bull Put Spread on SPY, using -15 delta and -5 delta wings. Selling equity put spreads have high win rates, and limited losses, making it a strong choice for option traders.
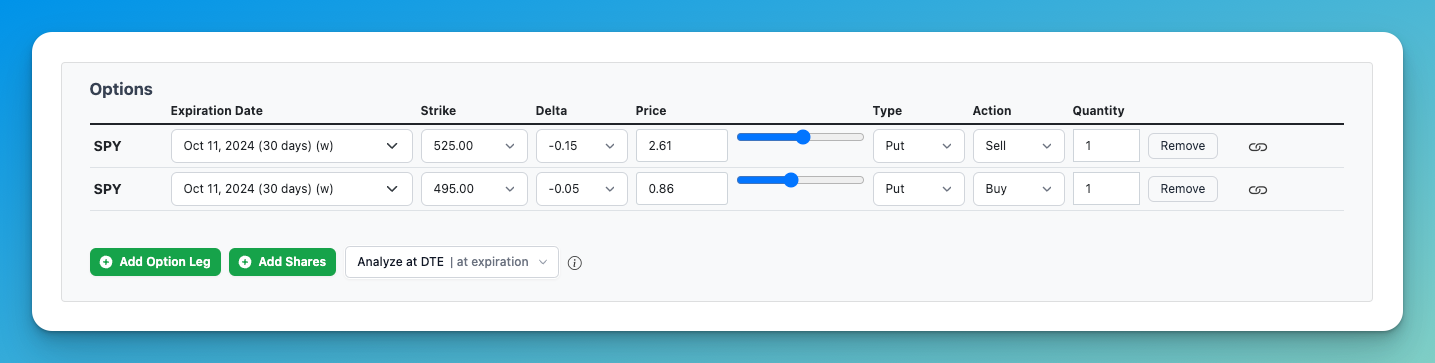
Setting Up the Strategy
- Search for 'SPY' ticker in our search form and navigate to the option page.
- Click the 'Profit & Loss Chart' tab
- Choose the "Bull Put Spread" strategy. (Alternatively, click this link to load the strategy directly: SPY Bull Put Spread)
- Select the expiration date for both options: (30 days from now).
- Select the -15 delta for the option you are selling by updating the delta in the dropdown to -0.15.
- Select the -5 delta for the option you are buying by updating the delta in the dropdown to -0.5.
Here is a look at what this strategy looks like:
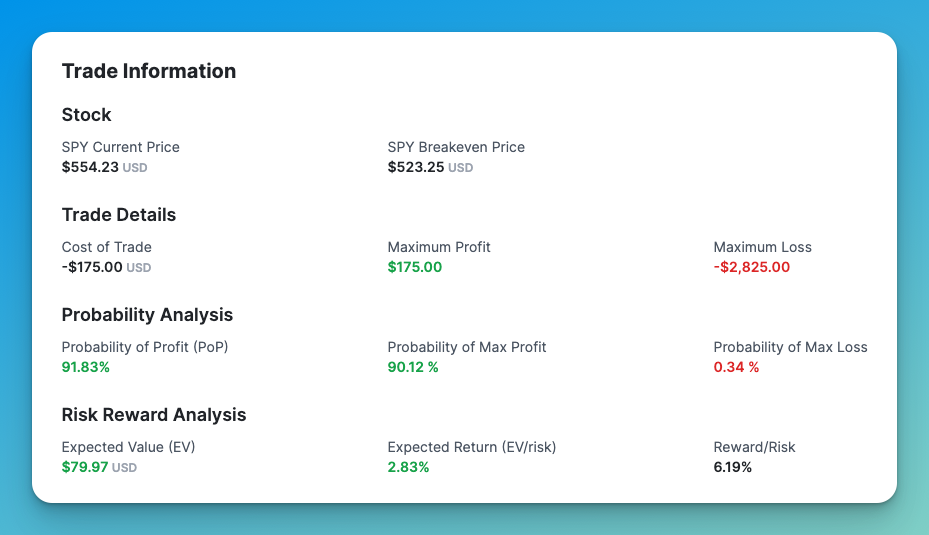
Analyzing the New Metrics
Now, let's look at how our new features provide deeper insights into this trade:
- Probability Analysis
- Probability of Profit (PoP): 91.83%
- This means you have a 91.83% chance of making at least some profit on this trade.
- Probability of Max Profit: 90.12%
- There's a 90% chance you'll achieve the maximum profit of $175.
- Probability of Max Loss: 0.34%
- Only a 0.34% chance of hitting the maximum loss of $2,825.
- Probability of Profit (PoP): 91.83%
- Risk Reward Analysis
- Expected Value (EV): $79.97
- On average, if you were to repeat this trade many times, you'd expect to make $79.97 per trade.
- Expected Return: 2.83%
- This represents your potential return as a percentage of the risk taken.
- Reward/Risk Ratio: 6.19%
- The potential reward is 6.19% of the max risk.
- Expected Value (EV): $79.97
Interpreting the Trade
This Bull Put Spread has a high probability of profit (91.83%) with a favorable risk-reward profile. The strategy caps your maximum loss at $2,825.00, while allowing for a maximum profit of $175.00. The Expected Value is positive, indicating that over time, and with many repeated occurences, this strategy should be profitable.
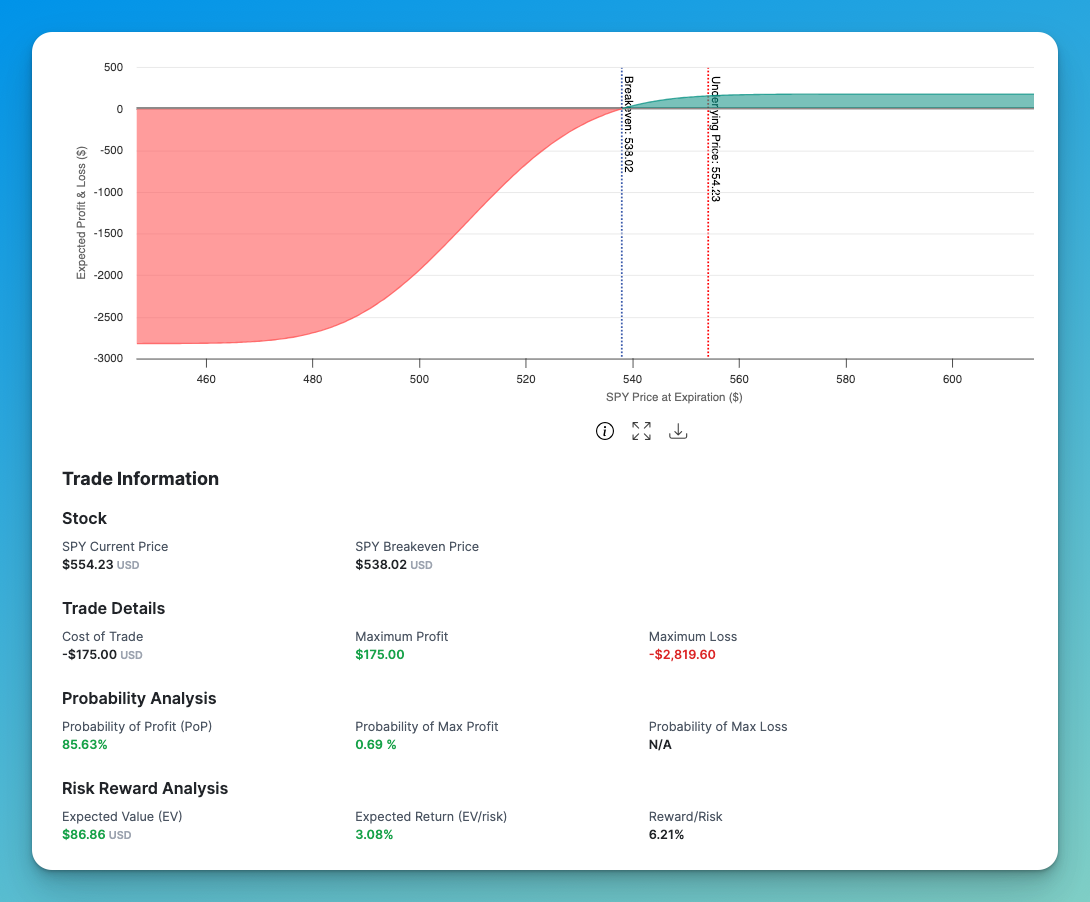
Analyze at DTE Feature
The example above shows the payoff at expiration (0 DTE). Now let's try adjusting this to 15 DTE to see how the strategy performs midway through its lifecycle. You can use the "Analyze at DTE" feature to see how these probabilities and payoffs change as you get closer to expiration, helping you decide on optimal entry and exit points.
Update the 'Analyze at DTE' dropdown to 15DTE.
- Observations:
- Probability of profit decreased slightly to from 91.83% to 85.63%. This is because the time value of the options hasn't fully decayed, so the potential profit is not yet fully realized.
- The risk profile of the 15DTE trade has a smoother curve, with less dramatic shifts around the strike prices.
Conclusion
Expected value and probability of profit are powerful tools for analyzing and comparing option trades. Incorporate these into your option trading to improve the chances of trading success.
These powerful new features are available exclusively to our premium subscribers. If you haven't upgraded yet, now is the perfect time to take your options trading to the next level!
We're constantly striving to improve OptionCharts and provide you with the best tools to succeed in your options trading journey. We'd love to hear your thoughts on these new changes. Please feel free to reach out to us directly with your feedback or visit us on X.
Happy trading, and here's to your continued success with OptionCharts!