Understanding the Option Contract Price History Chart
The Option Contract Price History chart helps traders visualize and analyze how an option contract's price has changed over time. This chart combines historical option price, volume, open interest, and greek values to give you a complete picture of an option's historical performance.
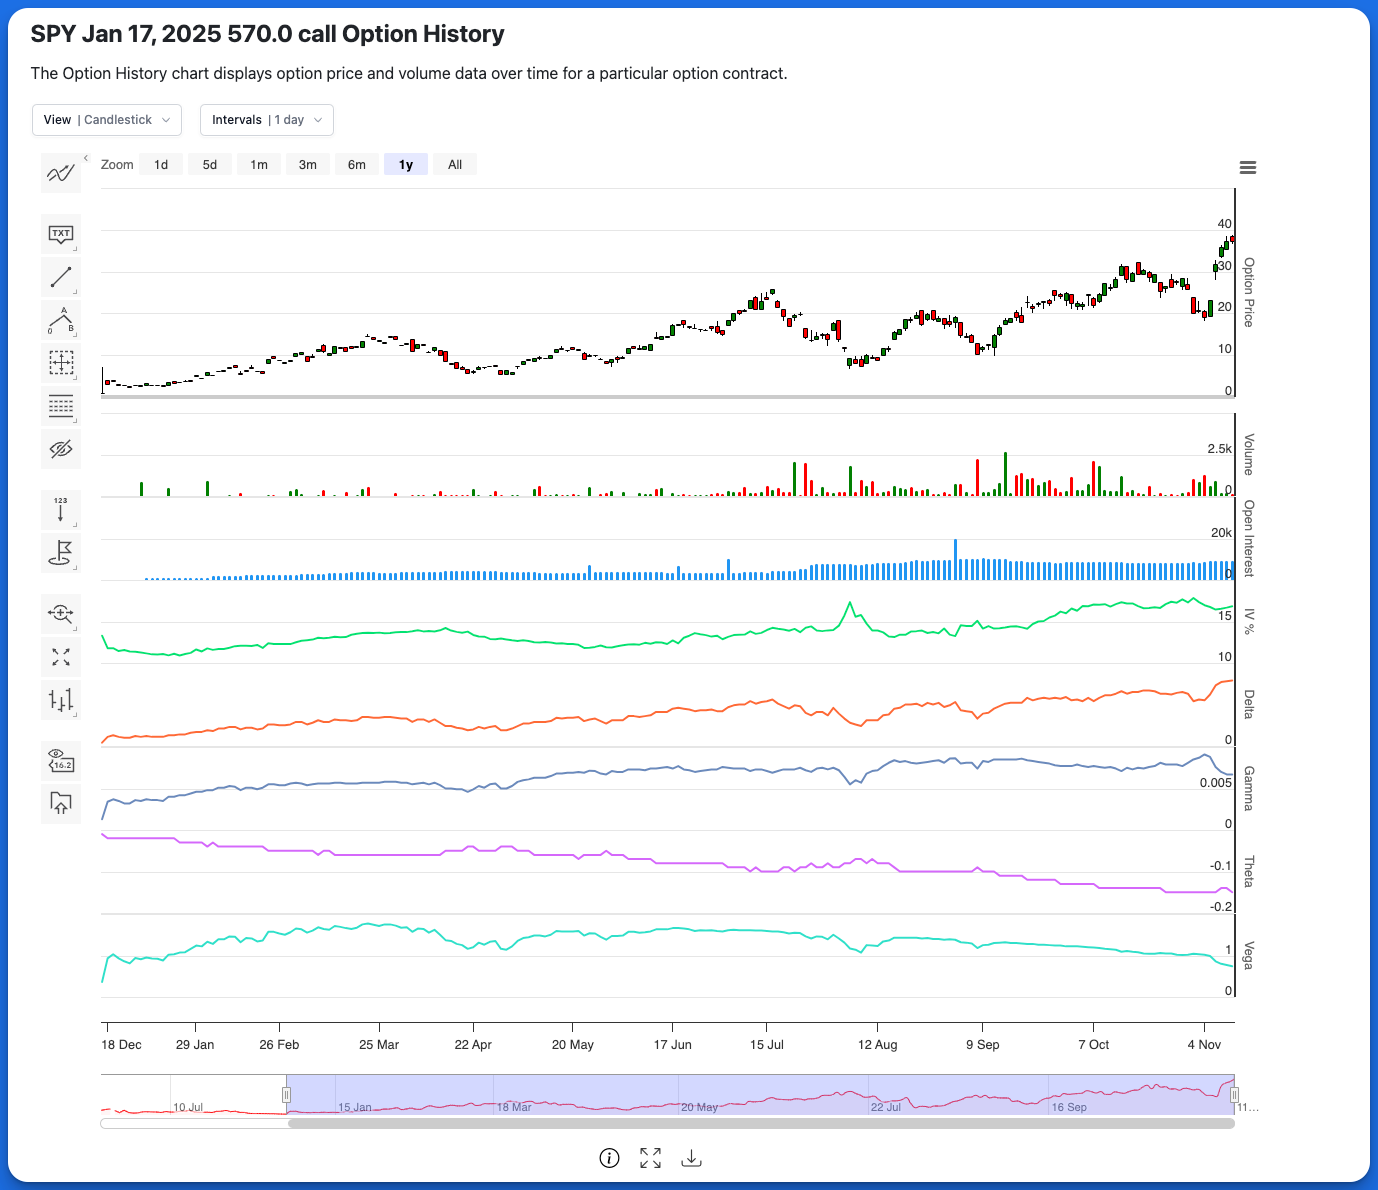
Chart Data Series
The chart displays the following data series over time:
- Option Price
- Option Volume
- Open interest
- Underlying Price
- Greeks - Delta, Gamma, Theta, Vega
Each component helps tell the complete story of how the option contract has traded over time, allowing you to view historical patterns and trends.
Key Features and Customization
Chart Type
The chart offers several chart types such as candlestick, line, or area. The default candlestick view shows open, high, low, and close prices for each time period. For a simpler visualization, switch to a basic line chart or an area chart.
Zoom Controls
Easily adjust the time range displayed on your chart using the zoom controls:
- 1d - Last trading day
- 5d - Last five trading days
- 1m - Last one month
- 3m, 6m, 1y - Longer-term views
- All - Full available history
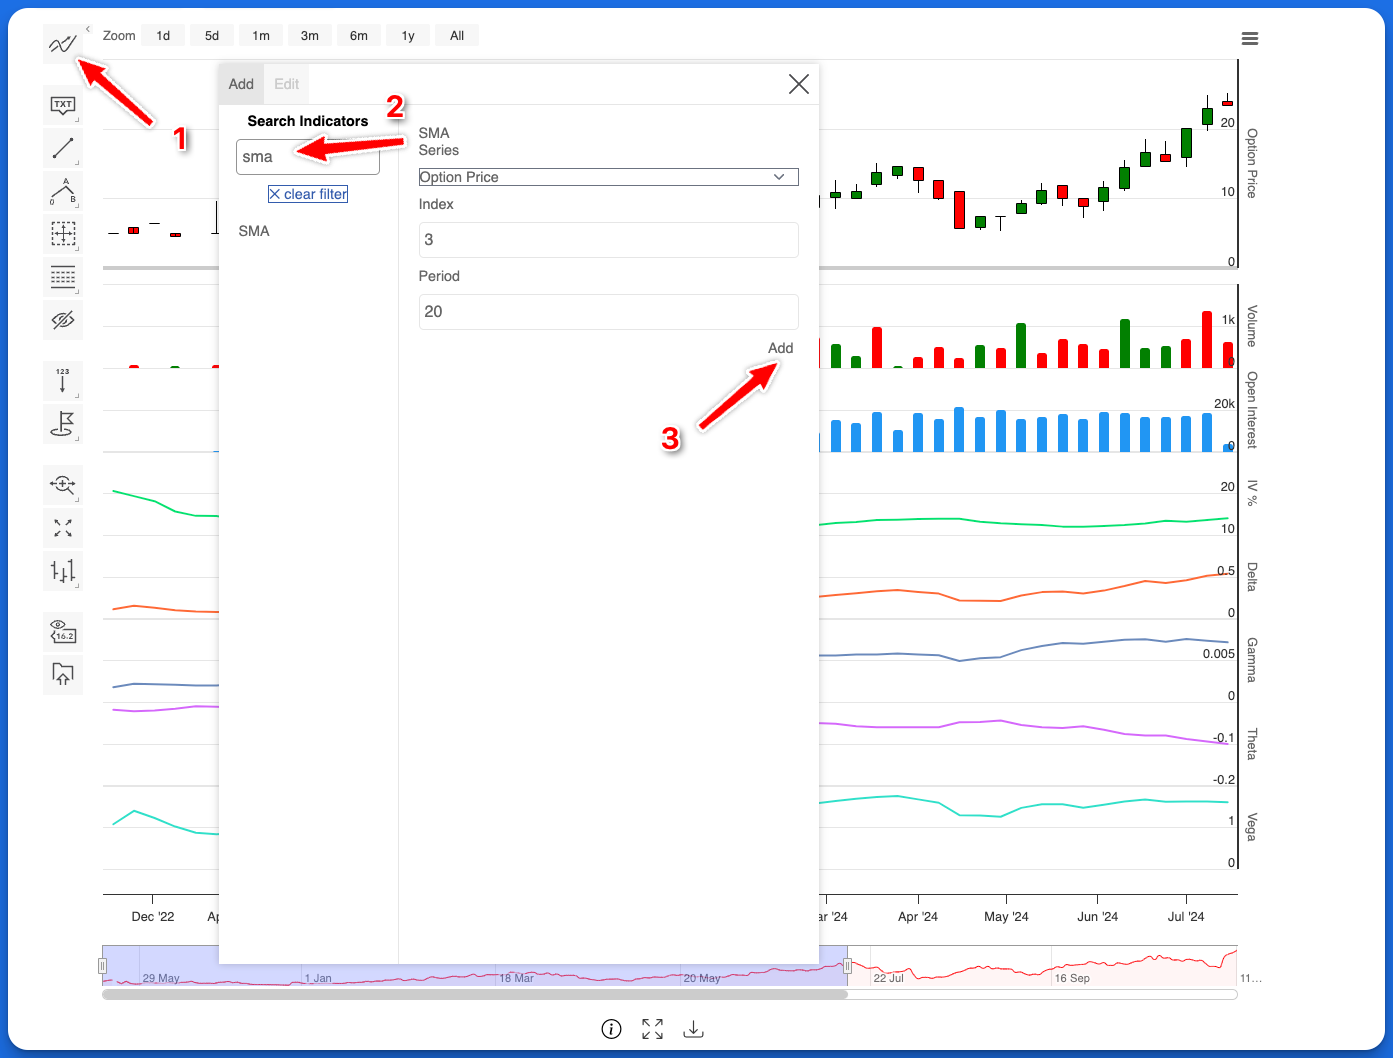
Technical Indicators
Enhance your analysis by adding technical indicators such as simple moving averages and Bollinger Bands.
- Click the indicator icon on the upper left side of the chart in the chart tools menu.
- Choose from a wide range of indicators including:
- Simple Moving Averages (SMA)
- Exponential Moving Averages (EMA)
- Bollinger Bands
- And more
- Customize the indicator settings and click 'Add' to apply it to your chart.