
GDYN Expected Move
The expected move for Grid Dynamics Holdings Inc (GDYN) options expiring Jan 19, 2029 (796 DTE) is ±$8.15 (±61.1%), a range of $5.20 to $21.50.
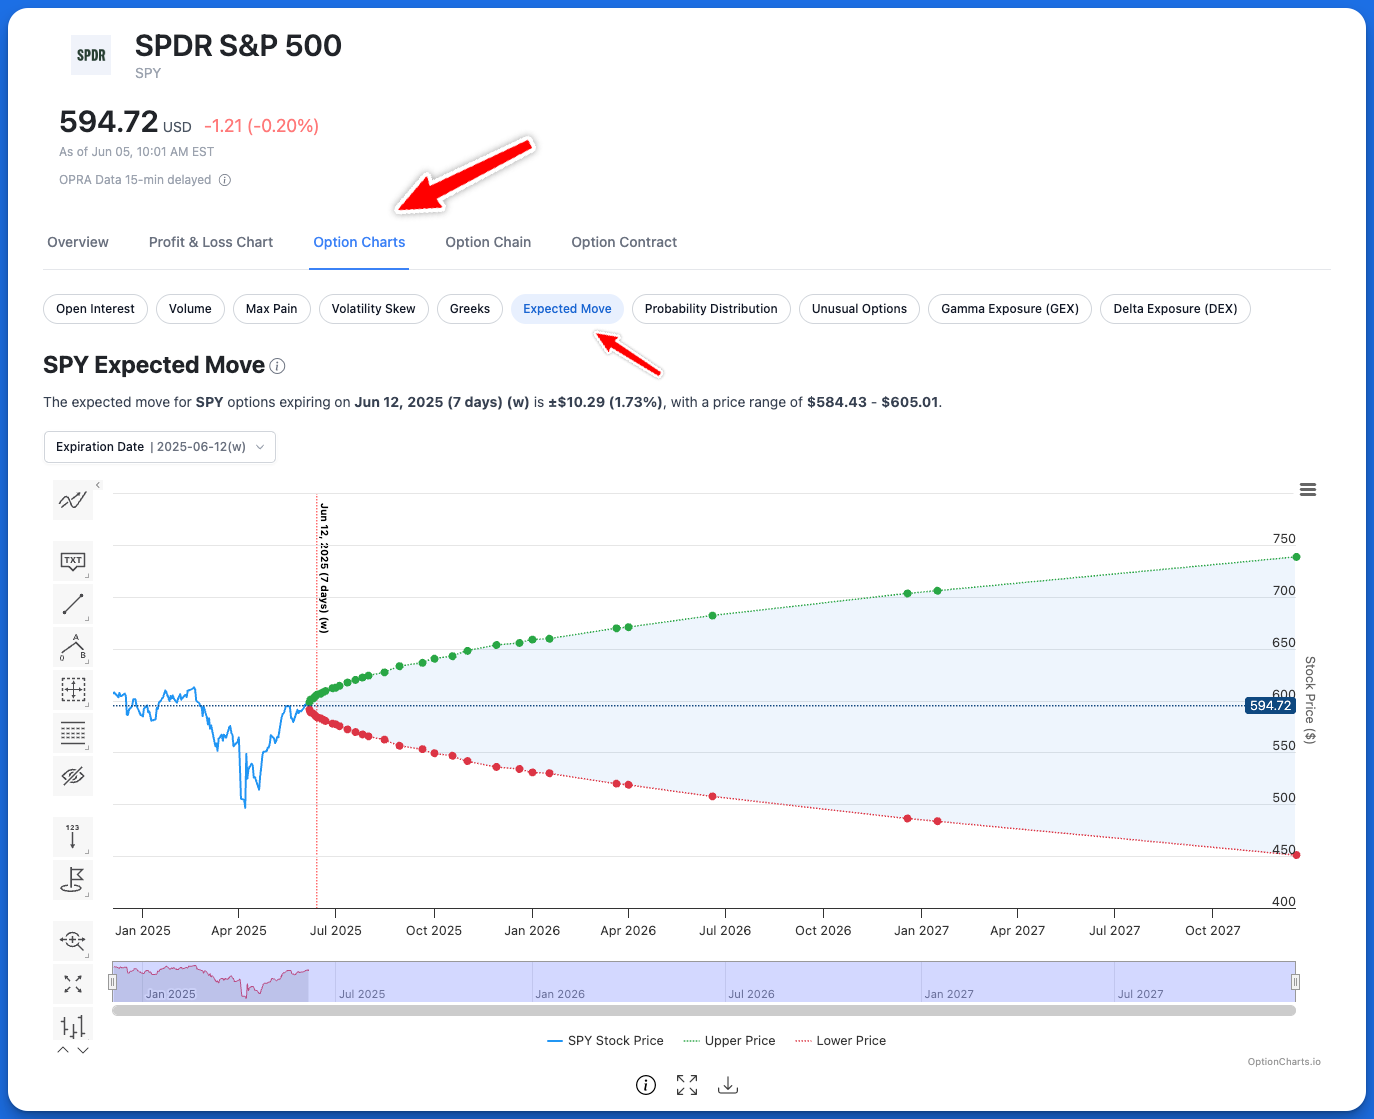
GDYN Expected Move by Expiry
The expected move for all expiration dates of GDYN.
| Expiration | Expected Move ($) | Expected Move (%) | Lower Price | Upper Price | Implied Volatility |
|---|---|---|---|---|---|
| Nov 20, 2026 5 DTE monthly | ±$0.82 | ±6.12% | $12.53 | $14.17 | 75.26% |
| Dec 18, 2026 33 DTE monthly | ±$1.49 | ±11.14% | $11.86 | $14.84 | 51.63% |
| Mar 19, 2027 124 DTE monthly | ±$2.96 | ±22.15% | $10.39 | $16.31 | 62.17% |
| Jun 17, 2027 214 DTE weekly | ±$3.41 | ±25.54% | $9.94 | $16.76 | 53.96% |
| Jan 21, 2028 432 DTE monthly | ±$6.68 | ±50.07% | $6.67 | $20.03 | 69.91% |
| Jan 19, 2029 796 DTE monthly | ±$8.15 | ±61.05% | $5.20 | $21.50 | 61.92% |
Click row to show expected move chart for that expiration
GDYN Expected Move FAQ
What is an expected move?
The expected move is the price range that option prices imply by a given date, usually one standard deviation. The stock is expected to finish inside that range about 68% of the time.
What is GDYN's expected move this week?
As of Nov 15, 2026, the expected move for Grid Dynamics options expiring Friday, Nov 20, 2026 is ±$0.82 (±6.1%), a range of $12.53 to $14.17. The table above shows the current expected move for every expiration date.
How has GDYN implied volatility changed recently?
Grid Dynamics 30-day implied volatility went from 67.7% on Oct 16, 2026 to 58.4% on Nov 13, 2026. See the GDYN implied volatility history for a longer view.
What is Grid Dynamics Holdings Inc?
Grid Dynamics Holdings Inc is a provider of technology consulting, platform and product engineering, and advanced analytics services.