
YETI Expected Move
The expected move for YETI Holdings Inc (YETI) options expiring Jan 21, 2028 (433 DTE) is ±$13.74 (±34.8%), a range of $25.69 to $53.16.
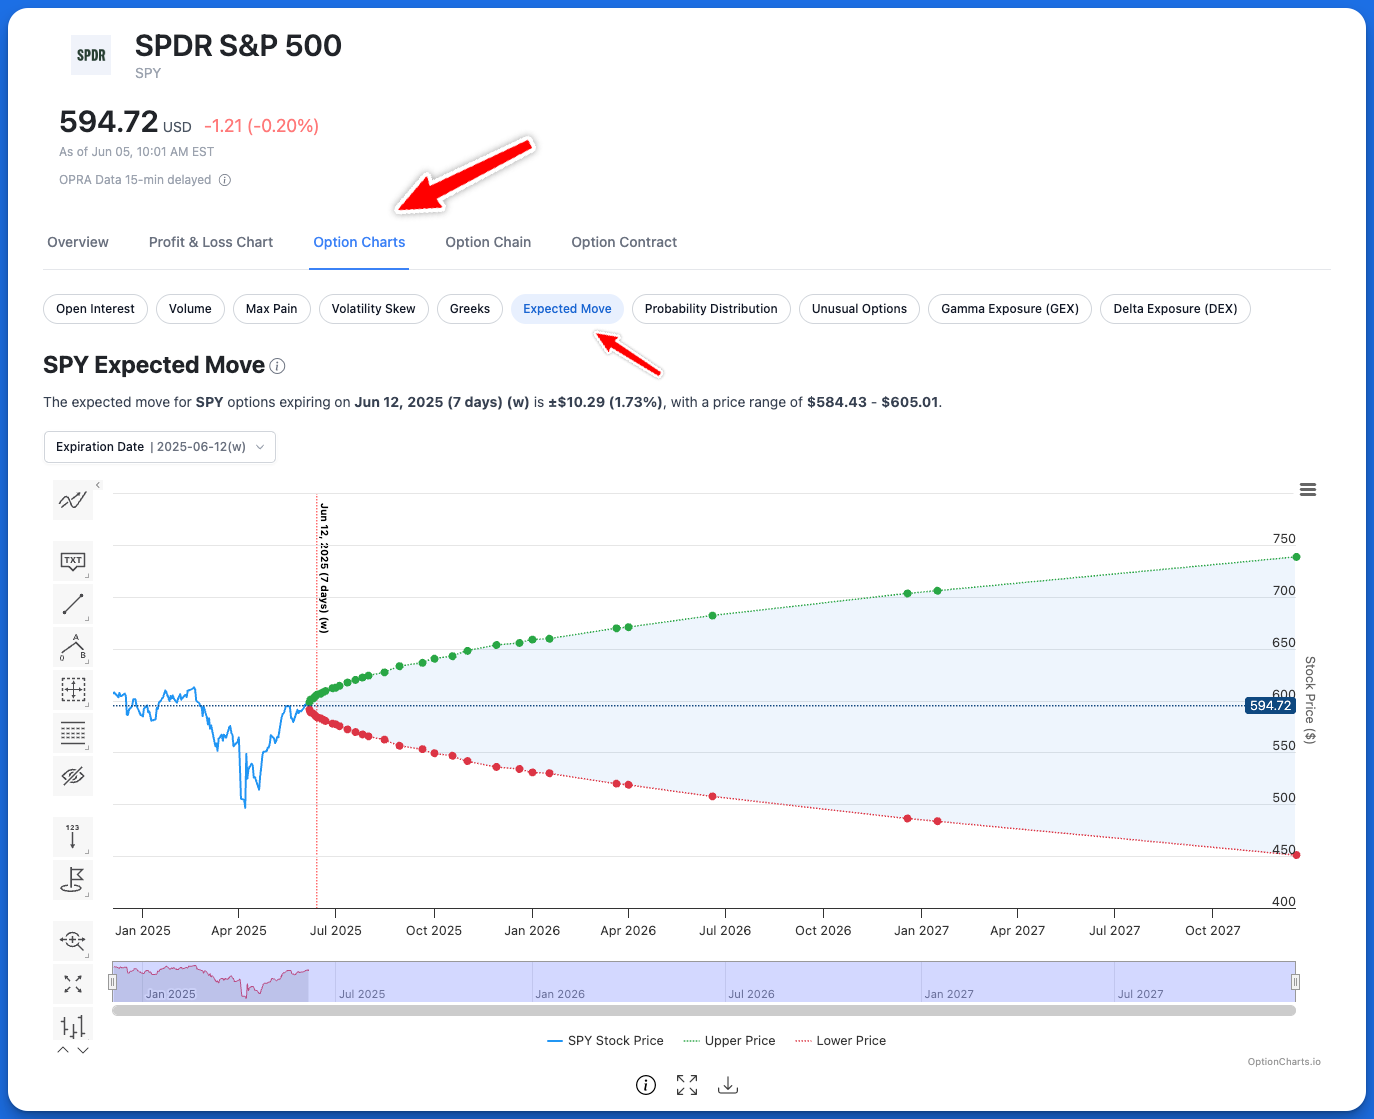
YETI Expected Move by Expiry
The expected move for all expiration dates of YETI.
| Expiration | Expected Move ($) | Expected Move (%) | Lower Price | Upper Price | Implied Volatility |
|---|---|---|---|---|---|
| Nov 20, 2026 6 DTE monthly | ±$1.25 | ±3.18% | $38.17 | $40.67 | 41.49% |
| Dec 18, 2026 34 DTE monthly | ±$3.00 | ±7.6% | $36.43 | $42.42 | 39.91% |
| Jan 15, 2027 62 DTE monthly | ±$4.11 | ±10.42% | $35.31 | $43.53 | 38.58% |
| Feb 19, 2027 97 DTE monthly | ±$6.20 | ±15.72% | $33.23 | $45.62 | 44.61% |
| May 21, 2027 188 DTE monthly | ±$8.99 | ±22.79% | $30.44 | $48.41 | 44.65% |
| Jan 21, 2028 433 DTE monthly | ±$13.74 | ±34.84% | $25.69 | $53.16 | 43.68% |
Click row to show expected move chart for that expiration
YETI Expected Move FAQ
What is an expected move?
The expected move is the price range that option prices imply by a given date, usually one standard deviation. The stock is expected to finish inside that range about 68% of the time.
What is YETI's expected move this week?
As of Nov 14, 2026, the expected move for YETI options expiring Friday, Nov 20, 2026 is ±$1.25 (±3.2%), a range of $38.17 to $40.67. The table above shows the current expected move for every expiration date.
How has YETI implied volatility changed recently?
YETI 30-day implied volatility went from 153.3% on Oct 16, 2026 to 40.2% on Nov 13, 2026. See the YETI implied volatility history for a longer view.
What is YETI Holdings Inc?
YETI Holdings Inc is a designer, marketer, and distributor of premium products for the outdoor and recreation market sold under the YETI brand.