What's New in the Profit and Loss Chart

Patrick Grenning
Founder
The profit and loss chart is one of the most-used tools on OptionCharts. Today we're releasing several updates that make it more powerful and easier to use.
What's New?
Adjust Implied Volatility
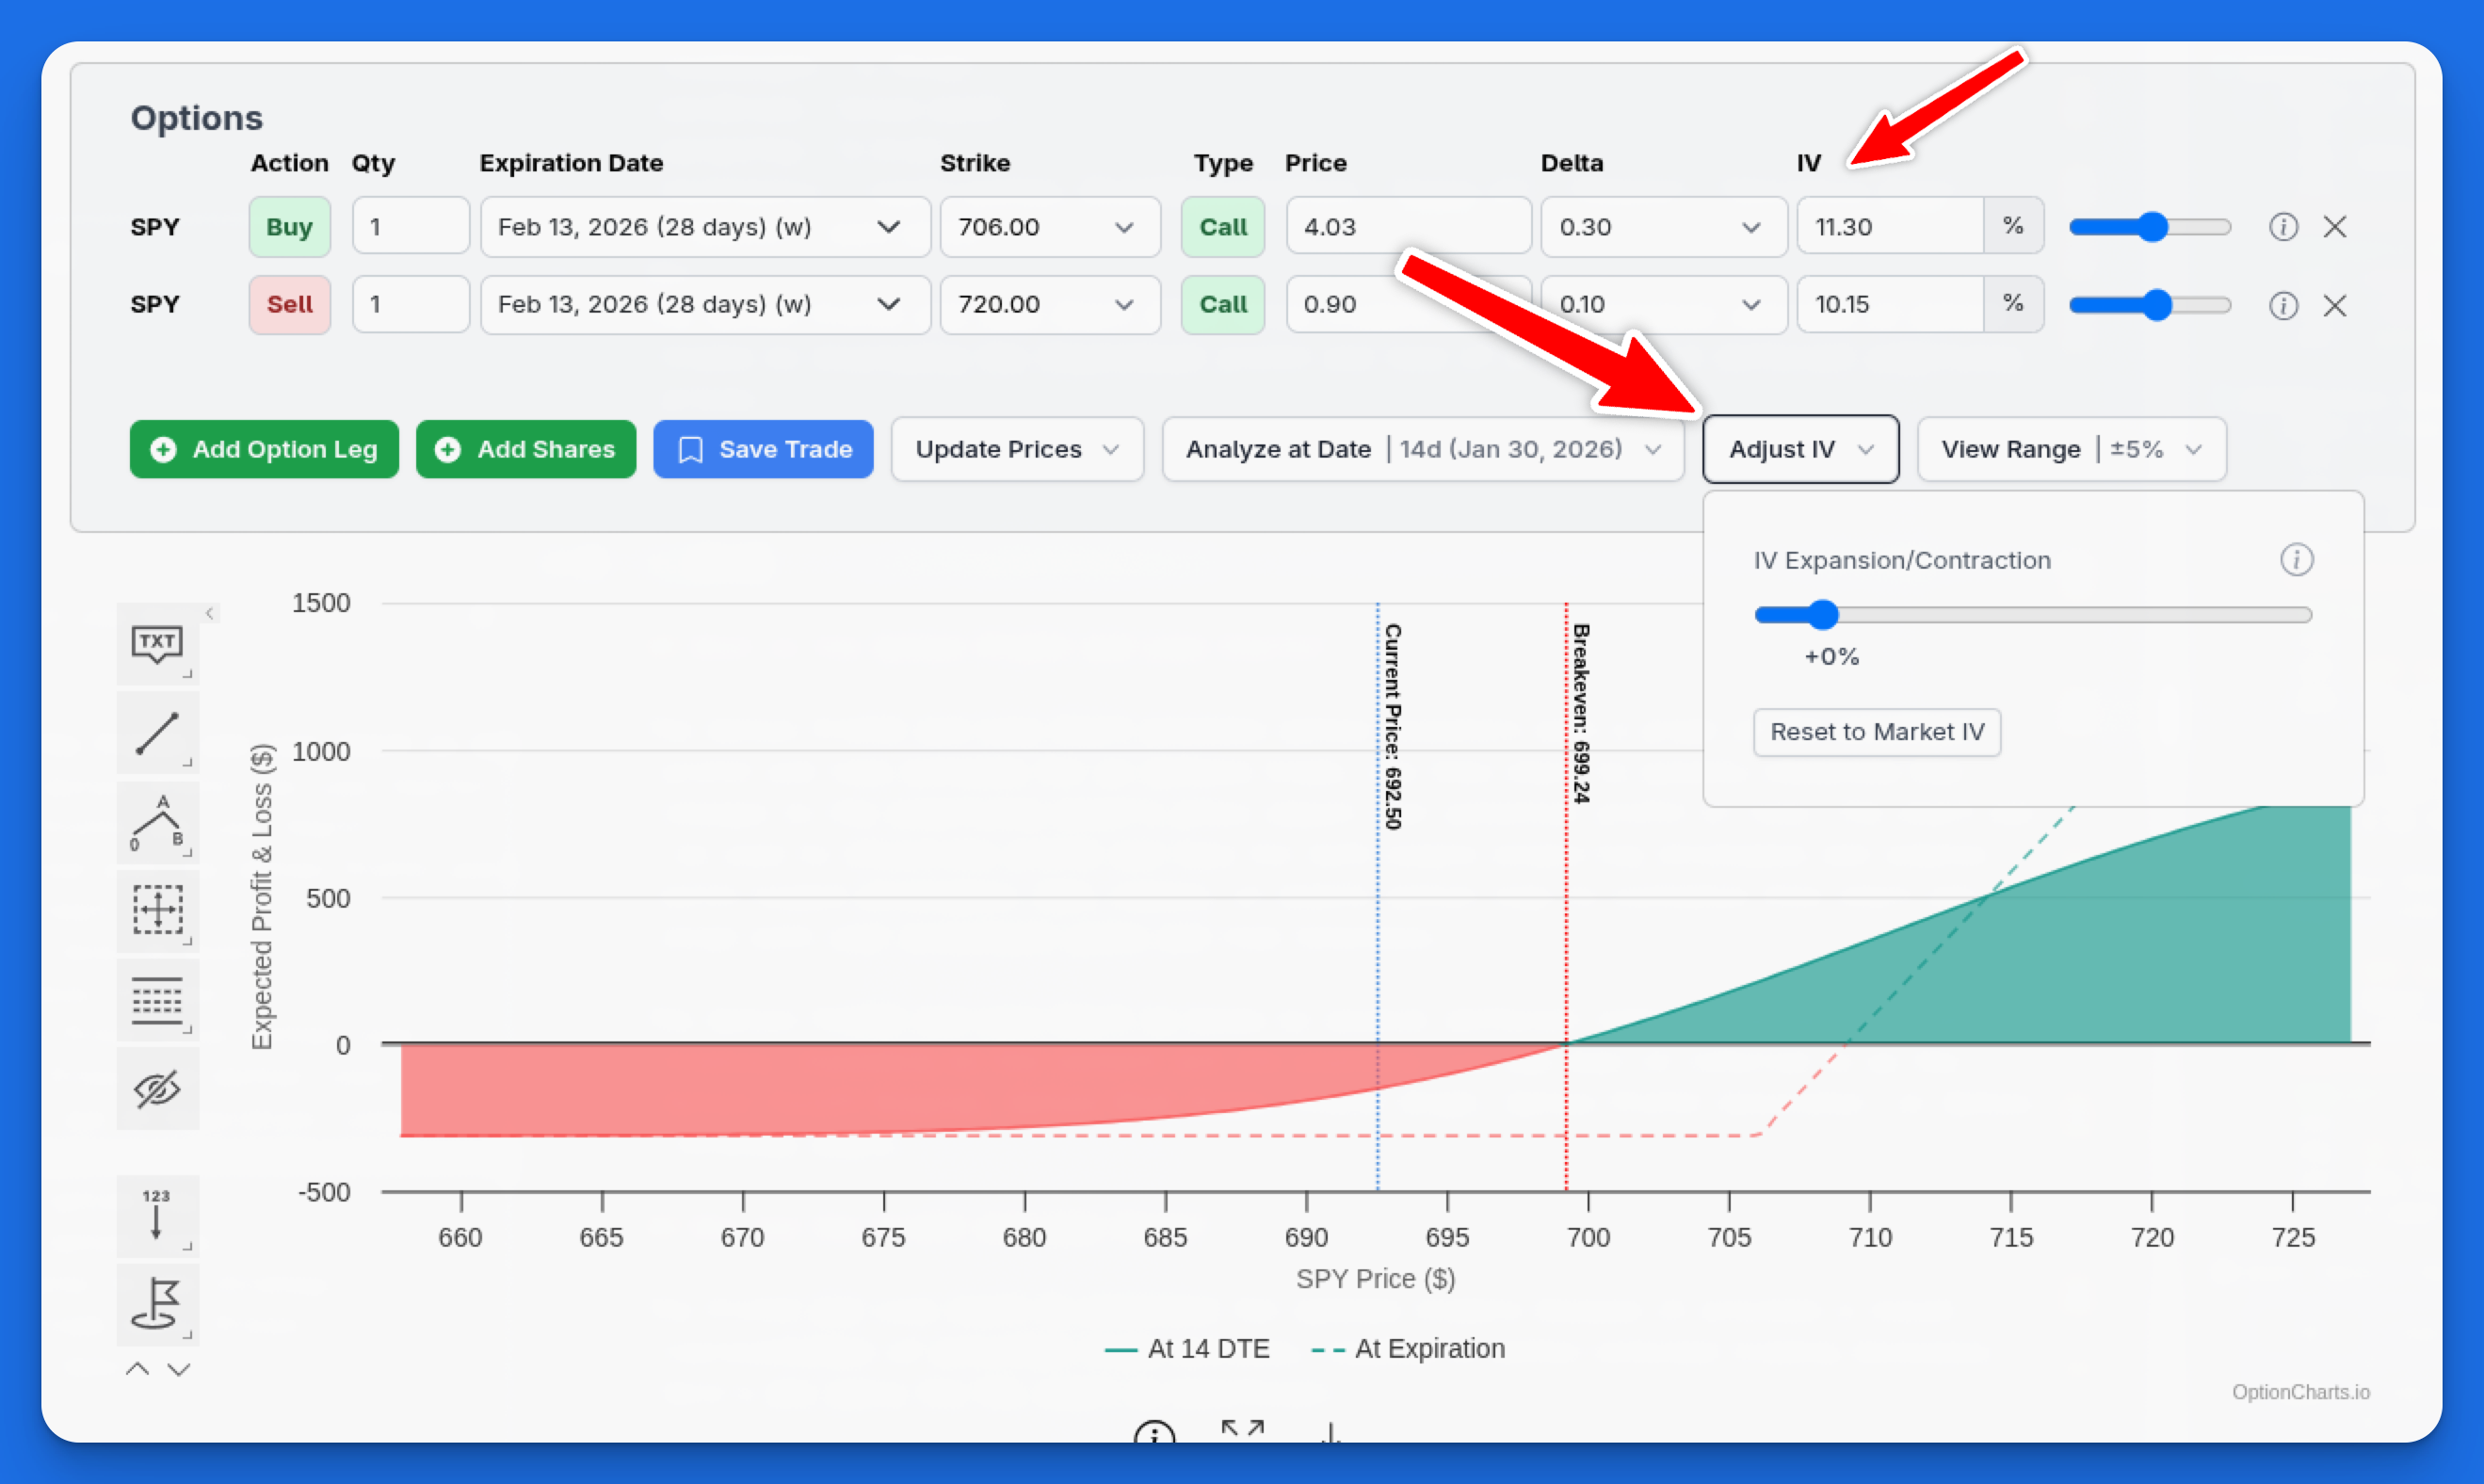
You can now adjust the implied volatility for your option trade. Use the adjust IV slider to shift volatility across all legs, or adjust IV per-leg for more precise analysis. This is useful for modeling how IV expansion or contraction affects your position's value before expiration.
For example, if you're holding a position through earnings, you can simulate what happens when IV crushes 20% after the announcement.
Dual-Line P&L
The chart now displays two P&L lines: one showing your projected profit at a date before expiration, and another showing the outcome at expiration. This dual-line view helps you understand how time decay and IV changes affect your position as it approaches expiration.
Select a date before expiration using the analyze at date dropdown to see both lines.
Fractional DTE Support
Need to analyze a position at 0.5 DTE for an intraday trade? The chart now supports fractional days to expiration. This is particularly useful for 0DTE traders who want to model positions at specific points during the trading day.
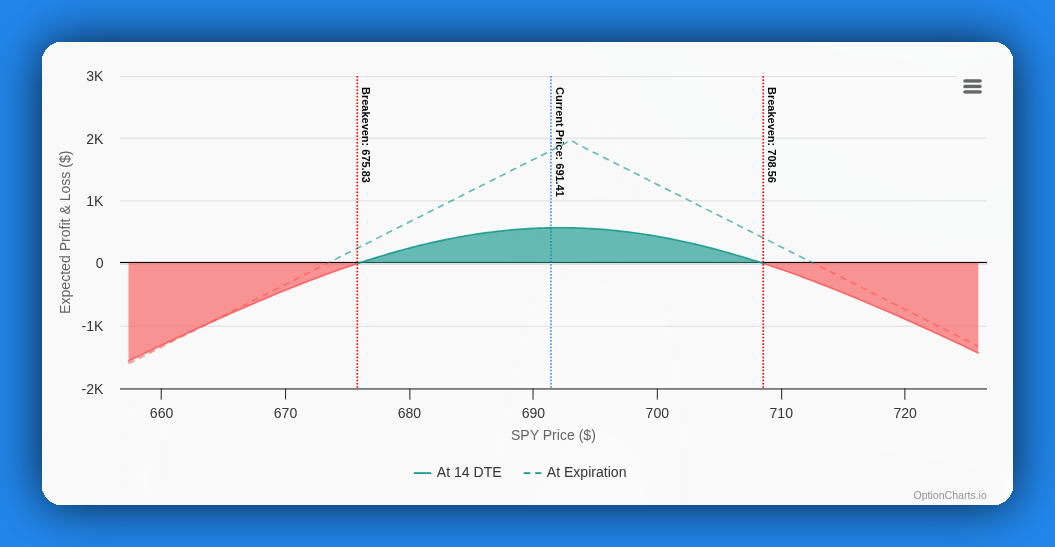
Multiple Break-Even Points
Some complex strategies like straddles, strangles, and iron condors have two break-even points. The chart now identifies and displays all break-evens, making it easier to visualize your profit zones at a glance.
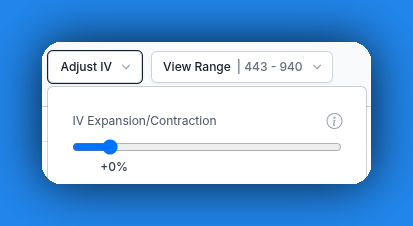
Range Sliders
We've added range sliders for quick adjustments to analyze-at-date, IV, and strike range. These controls make it faster to explore different scenarios.
Improved UI
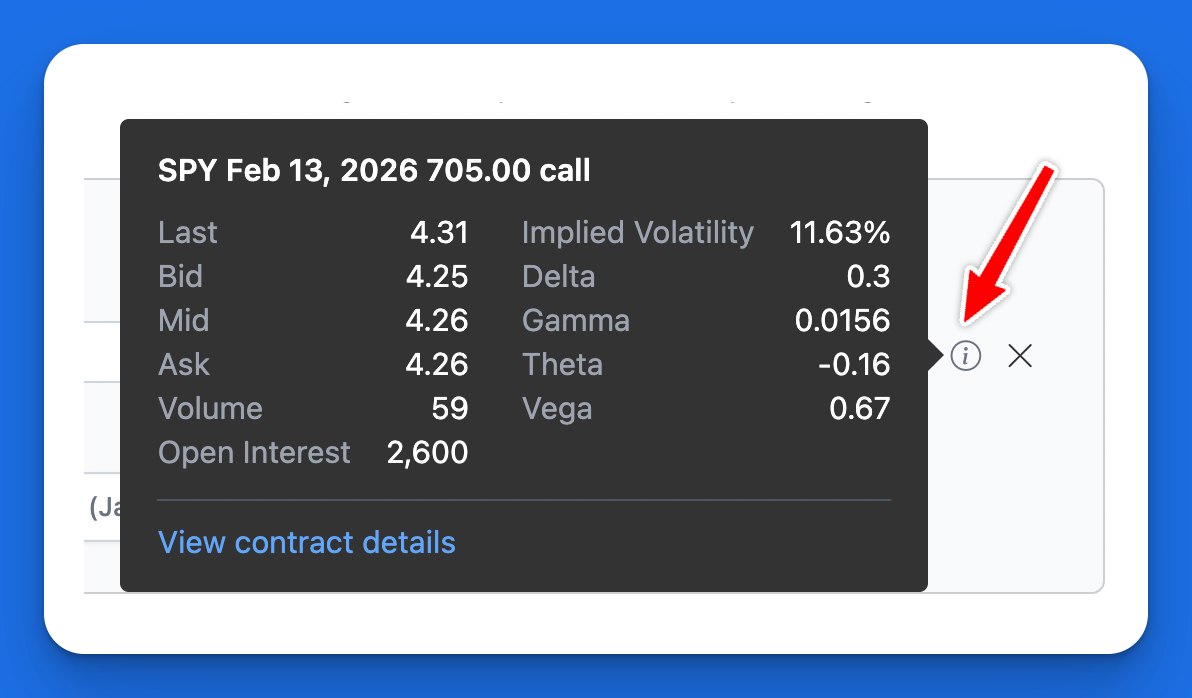
We made several UI improvements, including a more compact form layout. We also added improved tooltips. Hover over the info icon on any leg to see detailed contract details at a quick glance without needing to leave the chart.
How to Use the New Features
- Search for your ticker using the search button at the top.
- Click the Profit & Loss Chart tab.
- Choose an option strategy and adjust option legs as needed.
- Use the analyze-at-date slider to view the dual-line chart showing pre-expiry and at-expiration outcomes.
- Use the IV slider to adjust implied volatility and see how it affects your P&L.
Closing
These updates make the P&L chart more powerful and give you better visibility into your trades. Many of these improvements were based on your feedback and suggestions. Thank you for your support and ideas.